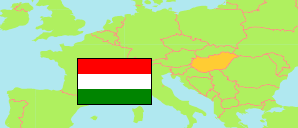
Oroszlány
District in Komárom-Esztergom
District
The population development of Oroszlány.
| Name | Status | Population Census 1980-01-01 | Population Census 1990-01-01 | Population Census 2001-02-01 | Population Census 2011-10-01 | Population Census 2022-10-01 | |
|---|---|---|---|---|---|---|---|
| Oroszlány | District | 28,486 | 28,770 | 28,220 | 26,163 | 25,822 | → |
| Komárom-Esztergom | County | 322,893 | 316,984 | 316,590 | 304,568 | 300,631 |
Contents: Towns and Villages
The population development of the towns and villages in Oroszlány.
| Name | Status | District | Population Census 1980-01-01 | Population Census 1990-01-01 | Population Census 2001-02-01 | Population Census 2011-10-01 | Population Census 2022-10-01 | |
|---|---|---|---|---|---|---|---|---|
| Bokod | Village | Oroszlány | 2,239 | 2,311 | 2,248 | 2,068 | 2,117 | → |
| Dad | Village | Oroszlány | 1,019 | 1,032 | 1,083 | 1,033 | 988 | → |
| Kecskéd | Village | Oroszlány | 1,673 | 1,723 | 1,919 | 1,988 | 2,083 | → |
| Kömlőd | Village | Oroszlány | 1,157 | 1,079 | 1,151 | 1,155 | 1,085 | → |
| Oroszlány | Town | Oroszlány | 20,613 | 20,982 | 20,280 | 18,446 | 18,078 | → |
| Szákszend | Village | Oroszlány | 1,785 | 1,643 | 1,539 | 1,473 | 1,471 | → |
Source: Hungarian Central Statistical Office.
Explanation: 2022 census results are final.