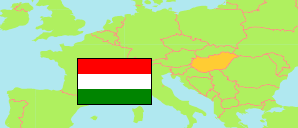
Hajdúszoboszló
District in Hajdú-Bihar
District
The population development of Hajdúszoboszló.
| Name | Status | Population Census 1980-01-01 | Population Census 1990-01-01 | Population Census 2001-02-01 | Population Census 2011-10-01 | Population Census 2022-10-01 | |
|---|---|---|---|---|---|---|---|
| Hajdúszoboszló | District | 42,009 | 42,161 | 42,793 | 43,061 | 41,884 | → |
| Hajdú-Bihar | County | 551,448 | 548,728 | 552,998 | 546,721 | 519,141 |
Contents: Towns and Villages
The population development of the towns and villages in Hajdúszoboszló.
| Name | Status | District | Population Census 1980-01-01 | Population Census 1990-01-01 | Population Census 2001-02-01 | Population Census 2011-10-01 | Population Census 2022-10-01 | |
|---|---|---|---|---|---|---|---|---|
| Ebes | Village | Hajdúszoboszló | 3,855 | 4,126 | 4,480 | 4,494 | 4,671 | → |
| Hajdúszoboszló | Town | Hajdúszoboszló | 23,396 | 23,891 | 23,425 | 23,933 | 23,174 | → |
| Hajdúszovát | Village | Hajdúszoboszló | 3,211 | 3,036 | 3,149 | 3,048 | 2,945 | → |
| Nádudvar | Town | Hajdúszoboszló | 9,238 | 8,715 | 9,074 | 8,853 | 8,224 | → |
| Nagyhegyes | Village | Hajdúszoboszló | 2,309 | 2,393 | 2,665 | 2,733 | 2,870 | → |
Source: Hungarian Central Statistical Office.
Explanation: 2022 census results are final.