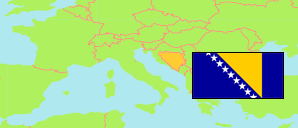
Modriča
Municipality in Serb Republic
Municipality
The population development of Modriča.
| Name | Native | Status | Population Census 1991-03-31 | Population Census 2013-10-01 | |
|---|---|---|---|---|---|
| Modriča | Модрича | Municipality | 30,547 | 24,490 | → |
| Republika Srpska [Serb Republic] | Република Српска | Entity | 1,569,332 | 1,170,342 |
Contents: Settlements
The population development of the settlements in Modriča.
| Name | Native | Status | Municipality | Population Census 1991-03-31 | Population Census 2013-10-01 | |
|---|---|---|---|---|---|---|
| Botajica | Ботајица | Settlement | Modriča | 1,019 | 579 | → |
| Čardak | Чардак | Settlement | Modriča | 1,006 | 353 | → |
| Dobrinja | Добриња | Settlement | Modriča | 437 | 446 | → |
| Donji Skugrić | Доњи Скугрић | Settlement | Modriča | ... | 910 | → |
| Dugo Polje | Дуго Поље | Settlement | Modriča | 1,596 | 994 | → |
| Garevac | Гаревац | Settlement | Modriča | 2,795 | 2,993 | → |
| Kladari Donji | Кладари Доњи | Settlement | Modriča | 1,046 | 362 | → |
| Kladari Gornji | Кладари Горњи | Settlement | Modriča | 448 | 359 | → |
| Koprivna | Копривна | Settlement | Modriča | 2,218 | 1,151 | → |
| Krčevljani | Крчевљани | Settlement | Modriča | 282 | 253 | → |
| Miloševac | Милошевац | Settlement | Modriča | 1,735 | 1,323 | → |
| Modriča | Модрича | Urban Settlement | Modriča | 10,454 | 8,996 | → |
| Skugrić Gornji | Скугрић Горњи | Settlement | Modriča | 1,453 | 785 | → |
| Tarevci | Таревци | Settlement | Modriča | 2,322 | 2,719 | → |
| Tolisa | Толиса | Settlement | Modriča | 858 | 358 | → |
| Vranjak | Врањак | Settlement | Modriča | 2,370 | 1,419 | → |
Source: Republika Srpska Institute of Statistics (web). Ethnic groups: Bosnia and Herzegovina Agency for Statistics (web).
Explanation: In case of the 2013 figures, the usually resident population is tabulated. In contrast, the ethnic group figures include also citizens of Bosnia and Herzegovina living and working abroad for many years.