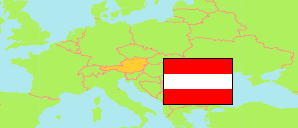
Kufstein
District in Tirol (Austria)
Contents: Population
The population development of Kufstein as well as related information and services (Wikipedia, Google, images).
| Name | Status | Population Census 1981-05-12 | Population Census 1991-05-15 | Population Census 2001-05-15 | Population Census 2011-10-31 | Population Census 2021-10-31 | Population Estimate 2024-01-01 | |
|---|---|---|---|---|---|---|---|---|
| Kufstein | District | 76,966 | 84,627 | 93,704 | 101,047 | 111,778 | 114,013 | |
| Österreich [Austria] | Republic | 7,555,338 | 7,795,786 | 8,032,857 | 8,401,940 | 8,969,068 | 9,159,993 |
Source: Statistik Austria.
Explanation: 2024 population figures are preliminary estimates.
Further information about the population structure:
| Gender (E 2023) | |
|---|---|
| Males | 55,882 |
| Females | 57,208 |
| Age Groups (E 2023) | |
|---|---|
| 0-17 years | 20,814 |
| 18-64 years | 71,692 |
| 65+ years | 20,584 |
| Age Distribution (E 2023) | |
|---|---|
| 90+ years | 846 |
| 80-89 years | 5,131 |
| 70-79 years | 8,707 |
| 60-69 years | 13,676 |
| 50-59 years | 17,539 |
| 40-49 years | 14,855 |
| 30-39 years | 15,907 |
| 20-29 years | 13,325 |
| 10-19 years | 11,343 |
| 0-9 years | 11,761 |
| Citizenship (E 2023) | |
|---|---|
| Austria | 91,286 |
| EU, EEA, Switzerland | 14,668 |
| Other Citizenship | 7,136 |
| Country of Birth (E 2023) | |
|---|---|
| Austria | 88,919 |
| EU, EEA, Switzerland | 14,613 |
| Other country | 9,558 |