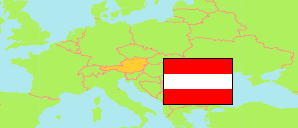
Burgenland
State in Austria
Contents: Subdivision
The population development in Burgenland as well as related information and services (Wikipedia, Google, images).
| Name | Status | Population Census 1981-05-12 | Population Census 1991-05-15 | Population Census 2001-05-15 | Population Census 2011-10-31 | Population Census 2021-10-31 | Population Estimate 2024-01-01 | |
|---|---|---|---|---|---|---|---|---|
| Burgenland | State | 269,771 | 270,880 | 277,558 | 285,685 | 297,506 | 301,966 | |
| Eisenstadt (Stadt) | District | 10,102 | 10,349 | 11,332 | 13,101 | 15,220 | 16,016 | → |
| Eisenstadt-Umgebung | District | 34,119 | 36,096 | 38,751 | 40,936 | 44,207 | 44,801 | → |
| Güssing | District | 28,960 | 27,977 | 27,193 | 26,624 | 25,685 | 26,081 | → |
| Jennersdorf | District | 18,937 | 18,045 | 17,934 | 17,573 | 17,148 | 17,239 | → |
| Mattersburg | District | 34,408 | 35,075 | 37,445 | 39,050 | 40,563 | 40,980 | → |
| Neusiedl am See | District | 48,458 | 49,397 | 51,726 | 55,337 | 60,834 | 61,876 | → |
| Oberpullendorf | District | 39,447 | 38,462 | 38,092 | 37,583 | 37,499 | 37,806 | → |
| Oberwart | District | 53,647 | 53,783 | 53,371 | 53,585 | 54,366 | 55,183 | → |
| Rust (Stadt) | District | 1,693 | 1,696 | 1,714 | 1,896 | 1,984 | 1,984 | → |
| Österreich [Austria] | Republic | 7,555,338 | 7,795,786 | 8,032,857 | 8,401,940 | 8,969,068 | 9,159,993 |
Source: Statistik Austria.
Explanation: 2024 population figures are preliminary estimates.
Further information about the population structure:
| Gender (E 2023) | |
|---|---|
| Males | 147,513 |
| Females | 153,737 |
| Age Groups (E 2023) | |
|---|---|
| 0-17 years | 48,246 |
| 18-64 years | 182,696 |
| 65+ years | 70,308 |
| Age Distribution (E 2023) | |
|---|---|
| 90+ years | 3,082 |
| 80-89 years | 17,043 |
| 70-79 years | 29,274 |
| 60-69 years | 45,696 |
| 50-59 years | 49,019 |
| 40-49 years | 40,907 |
| 30-39 years | 34,879 |
| 20-29 years | 27,482 |
| 10-19 years | 28,019 |
| 0-9 years | 25,849 |
| Citizenship (E 2023) | |
|---|---|
| Austria | 267,630 |
| EU, EEA, Switzerland | 23,739 |
| Other Citizenship | 9,881 |
| Country of Birth (E 2023) | |
|---|---|
| Austria | 261,107 |
| EU, EEA, Switzerland | 26,136 |
| Other country | 14,007 |