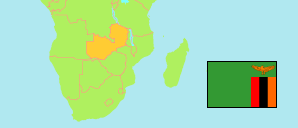
Chavuma
District in Zambia
Contents: Subdivision
The population in Chavuma as well as related information and services (Wikipedia, Google, images).
| Name | Status | Population Census 2010-10-16 | |
|---|---|---|---|
| Chavuma | District | 35,041 | |
| Chambi Mandalo | Ward | 2,494 | → |
| Chavuma Central | Ward | 7,263 | → |
| Chivombo Mbalango | Ward | 1,362 | → |
| Chiyeke | Ward | 5,875 | → |
| Kalombo Kamisamba | Ward | 2,300 | → |
| Kambuya Mukelangombe | Ward | 3,884 | → |
| Lingelengenda | Ward | 1,672 | → |
| Lingundu | Ward | 1,046 | → |
| Lukolwe Musumba | Ward | 1,152 | → |
| Nguvu | Ward | 1,486 | → |
| Nyatanda Nyambingila | Ward | 2,647 | → |
| Sanjongo | Ward | 1,388 | → |
| Sewe | Ward | 2,472 | → |
| Zambia | Republic | 13,092,666 |
Source: Central Statistical Office Zambia (web).
Explanation: Districts in the boundaries of 2016 and wards in the the boundaries of 2010; slight deviations from the actual situation are possible. Area figures are computed by using geospatial data.
Further information about the population structure:
| Gender (C 2010) | |
|---|---|
| Males | 17,003 |
| Females | 18,038 |
| Age Groups (C 2010) | |
|---|---|
| 0-14 years | 17,041 |
| 15-64 years | 16,425 |
| 65+ years | 1,575 |
| Age Distribution (C 2010) | |
|---|---|
| 0-9 years | 12,283 |
| 10-19 years | 8,714 |
| 20-29 years | 5,348 |
| 30-39 years | 3,465 |
| 40-49 years | 2,127 |
| 50-59 years | 1,099 |
| 60+ years | 2,005 |
| Urbanization (C 2010) | |
|---|---|
| Rural | 30,389 |
| Urban | 4,652 |