Help
Usage – Data
Tables
- [Click on country name]: zooms to that country in the map and selects it
- [Click on a table heading]: sorts the table accordingly and depicts the corresponding data column ("Total", "per Capita", "per Square km") by the map and the chart viewer
 Map
Map
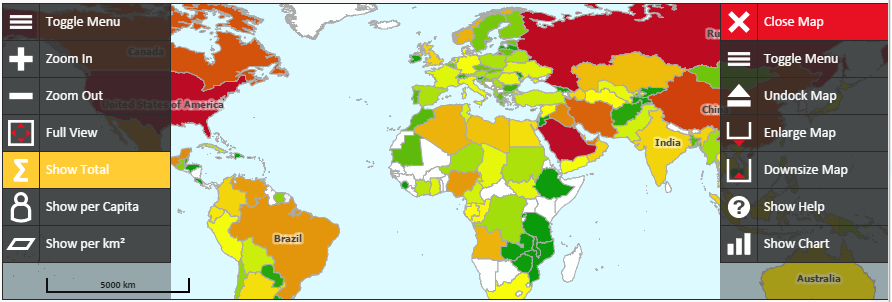
- Map icons: as explained in the figure.
- Zoom: by map icons [+] and [−], by double click (without and with pressed [shift] key), by dragging with pressed [shift] key, by mouse wheel, by [+] and [−] keys, or (on touch screens) by zooming or pinching two fingers.
- Pan: by dragging, by keyboard arrows, or (on touch screens) by panning one finger.
- Select: by single click on country area or label, or (on touch screens) by tapping; the corresponding table entry will be depicted and highlighted.
- Hover over a country: the characteristics of the country will be depicted as tooltip
- [Show Total] / [Show per Capita] / [Show per km²]: changes the map vizualization (depending on the topic only a subset may be available).
 Country Icons (from left to right)
- Sets the selected country as only country in the chart viewer (not on small mobile devices).
- Adds the selected country to the chart viewer (not on small mobile devices).
- Opens corresponding country page of »City Population«.
- Opens corresponding country page of CIA World Factbook.
- Opens corresponding country page of Wikipedia.
- Googles for the selected country and the current topic.
- Googles images for the selected country and current topic.
 Chart Viewer
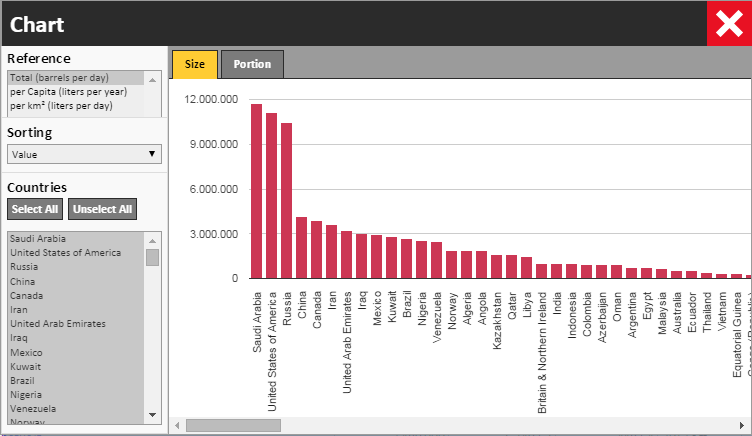
- [Reference]: allows changing the depicted data column ("Total", "per Capita", "per km²")
- [Sorting]: allows sorting the chart according to a property
- [Countries]: allows selecting the countries that are depicted by the chart viewer
- [Size]: shows a column chart.
- [Portion]: shows a pie chart (if reasonable)
- [ X ]: closes the chart viewer
Map and chart viewer do not work on small mobile devices.
Data
The 'per Capita' figures are calculated using the population for the given date of information (until 2014) according to CIA World Factbook data and (starting in 2015) according to official data of national statistical offices provided by »City Population«. For the 'per km²' figures, the current area figures given on the Land Area page are used.
References
- Almost all charts are based on data from the CIA World Factbook.
- Population figures are provided by City Population.