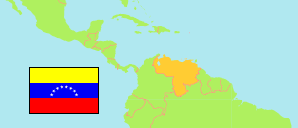
Zamora
Municipality in Venezuela
Contents: Population
The population development of Zamora as well as related information and services (Wikipedia, Google, images).
| Name | Status | Population Estimate 2001-06-30 | Population Estimate 2011-06-30 | Population Projection 2019-06-30 | |
|---|---|---|---|---|---|
| Zamora | Municipality | 132,295 | 149,984 | 161,867 | |
| Venezuela | Republic | 24,802,885 | 28,944,070 | 32,219,521 |
Source: Instituto Nacional de Estadística, Venezuela (web).
Explanation: The population projection does not consider emigration caused by the current economical and political situation in Venezuela.
Further information about the population structure:
| Gender (C 2011) | |
|---|---|
| Males | 73,311 |
| Females | 71,443 |
| Age Groups (C 2011) | |
|---|---|
| 0-14 years | 39,471 |
| 15-64 years | 98,017 |
| 65+ years | 7,266 |
| Age Distribution (C 2011) | |
|---|---|
| 0-9 years | 25,803 |
| 10-19 years | 28,479 |
| 20-29 years | 26,640 |
| 30-39 years | 22,008 |
| 40-49 years | 17,451 |
| 50-59 years | 12,869 |
| 60-69 years | 6,996 |
| 70-79 years | 3,120 |
| 80+ years | 1,388 |
| Urbanization (C 2011) | |
|---|---|
| Rural | 13,162 |
| Urban | 131,592 |
| Ethnic Group (C 2011) | |
|---|---|
| Indigenous | 60 |
| Afro-Venezuelan | 4,471 |
| Mestizos | 84,500 |
| White | 53,483 |
| Other Ethnic Group | 1,330 |
| Literacy (A10+) (C 2011) | |
|---|---|
| yes | 114,044 |
| no | 4,907 |