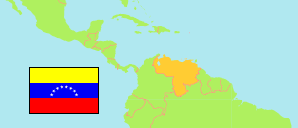
Yaracuy
State in Venezuela
Contents: Subdivision
The population development in Yaracuy as well as related information and services (Wikipedia, Google, images).
| Name | Status | Population Estimate 2001-06-30 | Population Estimate 2011-06-30 | Population Projection 2019-06-30 | |
|---|---|---|---|---|---|
| Yaracuy | State | 528,169 | 641,783 | 740,651 | |
| Arístides Bastidas | Municipality | 17,517 | 21,546 | 25,103 | → |
| Bolívar | Municipality | 27,322 | 33,006 | 37,905 | → |
| Bruzual | Municipality | 61,997 | 74,345 | 84,876 | → |
| Cocorote | Municipality | 37,531 | 45,297 | 51,981 | → |
| Independencia | Municipality | 53,735 | 64,967 | 74,657 | → |
| José Antonio Páez | Municipality | 16,532 | 20,401 | 23,832 | → |
| La Trinidad | Municipality | 14,963 | 18,300 | 21,225 | → |
| Manuel Monge | Municipality | 11,125 | 13,431 | 15,417 | → |
| Nirgua | Municipality | 53,623 | 62,762 | 70,270 | → |
| Peña | Municipality | 85,967 | 106,430 | 124,643 | → |
| San Felipe | Municipality | 88,316 | 109,341 | 128,056 | → |
| Sucre | Municipality | 16,678 | 20,623 | 24,129 | → |
| Urachiche | Municipality | 18,604 | 22,715 | 26,308 | → |
| Veroes | Municipality | 24,259 | 28,619 | 32,249 | → |
| Venezuela | Republic | 24,802,885 | 28,944,070 | 32,219,521 |
Source: Instituto Nacional de Estadística, Venezuela (web).
Explanation: The population projection does not consider emigration caused by the current economical and political situation in Venezuela.
Further information about the population structure:
| Gender (C 2011) | |
|---|---|
| Males | 302,095 |
| Females | 298,757 |
| Age Groups (C 2011) | |
|---|---|
| 0-14 years | 173,747 |
| 15-64 years | 393,003 |
| 65+ years | 34,102 |
| Age Distribution (C 2011) | |
|---|---|
| 0-9 years | 113,166 |
| 10-19 years | 123,429 |
| 20-29 years | 105,238 |
| 30-39 years | 87,288 |
| 40-49 years | 70,298 |
| 50-59 years | 51,009 |
| 60-69 years | 27,815 |
| 70-79 years | 14,763 |
| 80+ years | 7,846 |
| Urbanization (C 2011) | |
|---|---|
| Rural | 112,844 |
| Urban | 488,008 |
| Ethnic Group (C 2011) | |
|---|---|
| Indigenous | 496 |
| Afro-Venezuelan | 29,155 |
| Mestizos | 349,030 |
| White | 212,194 |
| Other Ethnic Group | 7,239 |
| Literacy (A10+) (C 2011) | |
|---|---|
| yes | 458,238 |
| no | 29,448 |