
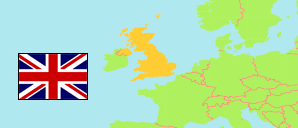
East Lindsey
District in Lincolnshire (United Kingdom)
Contents: Population
The population development of East Lindsey as well as related information and services (Wikipedia, Google, images).
| Name | Status | Population Estimate 1981-06-30 | Population Estimate 1991-06-30 | Population Estimate 2001-06-30 | Population Estimate 2011-06-30 | Population Estimate 2021-06-30 | Population Estimate 2025-06-30 | |
|---|---|---|---|---|---|---|---|---|
| East Lindsey | District | 105,500 | 117,700 | 130,700 | 136,683 | 142,916 | 146,756 | |
| Great Britain and Northern Ireland | United Kingdom | 56,357,500 | 57,438,700 | 59,113,000 | 63,285,145 | 66,983,488 | 69,487,000 |
Source: UK National Statistics, National Records of Scotland, The Northern Ireland Statistics and Research Agency.
Explanation: Population estimates for Northern Ireland in 2025 are not yet available.
Further information about the population structure:
| Gender (E 2025) | |
|---|---|
| Males | 71,482 |
| Females | 75,274 |
| Age Groups (E 2025) | |
|---|---|
| 0-17 years | 23,188 |
| 18-64 years | 76,375 |
| 65+ years | 47,193 |
| Age Distribution (E 2025) | |
|---|---|
| 90+ years | 1,785 |
| 80-89 years | 10,568 |
| 70-79 years | 22,000 |
| 60-69 years | 26,587 |
| 50-59 years | 20,920 |
| 40-49 years | 13,405 |
| 30-39 years | 14,048 |
| 20-29 years | 11,903 |
| 10-19 years | 14,078 |
| 0-9 years | 11,462 |