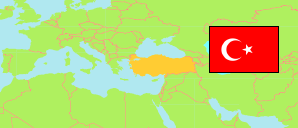
Erzurum
Metropolitan Province in Turkey
Contents: Subdivision
The population development in Erzurum as well as related information and services (Wikipedia, Google, images).
| Name | Status | Population Estimate 2009-12-31 | Population Estimate 2013-12-31 | Population Estimate 2017-12-31 | Population Estimate 2023-12-31 | |
|---|---|---|---|---|---|---|
| Erzurum | Metropolitan Province | 774,207 | 766,729 | 760,476 | 749,993 | |
| Aşkale | District | 24,858 | 24,270 | 23,130 | 21,410 | → |
| Aziziye | District | 50,453 | 50,989 | 59,309 | 68,251 | → |
| Çat | District | 20,338 | 19,192 | 17,355 | 15,457 | → |
| Hınıs | District | 31,330 | 29,165 | 26,163 | 24,419 | → |
| Horasan | District | 44,073 | 42,403 | 39,467 | 36,359 | → |
| İspir | District | 16,885 | 16,248 | 14,469 | 15,914 | → |
| Karaçoban | District | 25,715 | 24,968 | 23,190 | 21,961 | → |
| Karayazı | District | 33,380 | 31,747 | 28,337 | 24,559 | → |
| Köprüköy | District | 18,330 | 17,721 | 16,167 | 14,184 | → |
| Narman | District | 17,318 | 15,336 | 13,399 | 11,959 | → |
| Oltu | District | 31,265 | 31,346 | 31,001 | 30,296 | → |
| Olur | District | 8,085 | 7,181 | 6,398 | 6,737 | → |
| Palandöken | District | 152,680 | 161,482 | 169,478 | 177,109 | → |
| Pasinler | District | 32,383 | 31,581 | 29,302 | 26,833 | → |
| Pazaryolu | District | 4,720 | 4,178 | 3,662 | 4,290 | → |
| Şenkaya | District | 21,985 | 20,771 | 18,101 | 16,112 | → |
| Tekman | District | 30,557 | 28,772 | 25,957 | 22,686 | → |
| Tortum | District | 22,495 | 18,819 | 14,391 | 17,418 | → |
| Uzundere | District | 8,686 | 8,347 | 7,598 | 7,973 | → |
| Yakutiye | District | 178,671 | 182,213 | 193,602 | 186,066 | → |
| Türkiye [Turkey] | Republic | 72,561,312 | 76,667,864 | 80,810,525 | 85,372,377 |
Source: State Institute of Statistics, Republic of Türkiye.
Explanation: Area figures of districts are computed by using geospatial data.
Further information about the population structure:
| Gender (E 2023) | |
|---|---|
| Males | 372,622 |
| Females | 377,371 |
| Age Groups (E 2023) | |
|---|---|
| 0-14 years | 177,890 |
| 15-64 years | 499,316 |
| 65+ years | 72,787 |
| Age Distribution (E 2023) | |
|---|---|
| 90+ years | 2,280 |
| 80-89 years | 11,790 |
| 70-79 years | 32,875 |
| 60-69 years | 56,873 |
| 50-59 years | 76,710 |
| 40-49 years | 93,820 |
| 30-39 years | 102,873 |
| 20-29 years | 129,763 |
| 10-19 years | 126,601 |
| 0-9 years | 116,408 |