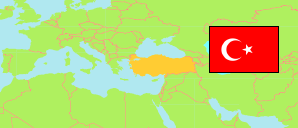
Burdur
Province in Turkey
Contents: Subdivision
The population development in Burdur as well as related information and services (Wikipedia, Google, images).
| Name | Status | Population Estimate 2009-12-31 | Population Estimate 2013-12-31 | Population Estimate 2017-12-31 | Population Estimate 2023-12-31 | |
|---|---|---|---|---|---|---|
| Burdur | Province | 251,550 | 257,267 | 264,779 | 277,452 | |
| Ağlasun | District | 9,467 | 8,889 | 8,255 | 7,929 | → |
| Altınyayla | District | 5,721 | 5,853 | 5,403 | 5,224 | → |
| Bucak | District | 59,800 | 64,188 | 65,282 | 68,290 | → |
| Çavdır | District | 12,950 | 13,052 | 12,729 | 13,095 | → |
| Çeltikçi | District | 6,181 | 5,574 | 5,195 | 5,337 | → |
| Gölhisar | District | 21,130 | 21,981 | 22,409 | 23,920 | → |
| Karamanlı | District | 7,820 | 8,084 | 7,924 | 8,249 | → |
| Kemer | District | 4,071 | 3,786 | 3,300 | 2,888 | → |
| Merkez | District | 96,422 | 98,743 | 108,297 | 117,537 | → |
| Tefenni | District | 10,222 | 10,144 | 10,479 | 10,546 | → |
| Yeşilova | District | 17,766 | 16,973 | 15,506 | 14,437 | → |
| Türkiye [Turkey] | Republic | 72,561,312 | 76,667,864 | 80,810,525 | 85,372,377 |
Source: State Institute of Statistics, Republic of Türkiye.
Explanation: Area figures of districts are computed by using geospatial data.
Further information about the population structure:
| Gender (E 2023) | |
|---|---|
| Males | 138,441 |
| Females | 139,011 |
| Age Groups (E 2023) | |
|---|---|
| 0-14 years | 44,365 |
| 15-64 years | 187,785 |
| 65+ years | 45,302 |
| Age Distribution (E 2023) | |
|---|---|
| 90+ years | 1,563 |
| 80-89 years | 8,394 |
| 70-79 years | 19,863 |
| 60-69 years | 33,309 |
| 50-59 years | 36,159 |
| 40-49 years | 36,802 |
| 30-39 years | 33,618 |
| 20-29 years | 43,231 |
| 10-19 years | 35,866 |
| 0-9 years | 28,647 |