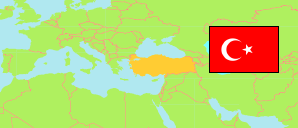
Antalya
Metropolitan Province in Turkey
Contents: Subdivision
The population development in Antalya as well as related information and services (Wikipedia, Google, images).
| Name | Status | Population Estimate 2009-12-31 | Population Estimate 2013-12-31 | Population Estimate 2017-12-31 | Population Estimate 2023-12-31 | |
|---|---|---|---|---|---|---|
| Antalya | Metropolitan Province | 1,919,729 | 2,158,265 | 2,364,396 | 2,696,249 | |
| Akseki | District | 18,203 | 13,083 | 10,471 | 11,896 | → |
| Aksu | District | 61,200 | 67,476 | 69,967 | 80,350 | → |
| Alanya | District | 241,451 | 276,277 | 299,464 | 359,891 | → |
| Demre | District | 24,664 | 25,718 | 25,928 | 27,762 | → |
| Döşemealtı | District | 40,555 | 52,013 | 59,948 | 86,109 | → |
| Elmalı | District | 37,645 | 38,563 | 38,651 | 41,240 | → |
| Finike | District | 46,095 | 46,530 | 48,948 | 50,688 | → |
| Gazipaşa | District | 48,369 | 48,134 | 49,555 | 55,185 | → |
| Gündoğmuş | District | 9,783 | 8,162 | 7,593 | 8,259 | → |
| İbradı | District | 3,509 | 2,865 | 2,646 | 4,243 | → |
| Kaş | District | 52,564 | 55,061 | 57,123 | 64,014 | → |
| Kemer | District | 35,889 | 42,421 | 42,568 | 49,695 | → |
| Kepez | District | 394,672 | 450,734 | 519,966 | 614,135 | → |
| Konyaaltı | District | 106,748 | 137,670 | 172,920 | 196,498 | → |
| Korkuteli | District | 50,698 | 51,857 | 53,610 | 59,295 | → |
| Kumluca | District | 65,543 | 66,159 | 67,942 | 74,353 | → |
| Manavgat | District | 179,379 | 208,526 | 226,394 | 258,367 | → |
| Muratpaşa | District | 396,906 | 453,255 | 488,670 | 512,700 | → |
| Serik | District | 105,856 | 113,761 | 122,032 | 141,569 | → |
| Türkiye [Turkey] | Republic | 72,561,312 | 76,667,864 | 80,810,525 | 85,372,377 |
Source: State Institute of Statistics, Republic of Türkiye.
Explanation: Area figures of districts are computed by using geospatial data.
Further information about the population structure:
| Gender (E 2023) | |
|---|---|
| Males | 1,357,198 |
| Females | 1,339,051 |
| Age Groups (E 2023) | |
|---|---|
| 0-14 years | 536,532 |
| 15-64 years | 1,897,782 |
| 65+ years | 261,935 |
| Age Distribution (E 2023) | |
|---|---|
| 90+ years | 6,385 |
| 80-89 years | 38,770 |
| 70-79 years | 114,692 |
| 60-69 years | 235,391 |
| 50-59 years | 346,407 |
| 40-49 years | 437,559 |
| 30-39 years | 414,575 |
| 20-29 years | 378,435 |
| 10-19 years | 380,802 |
| 0-9 years | 343,233 |