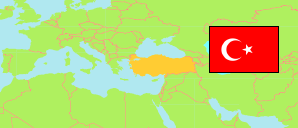
Bilecik
Province in Turkey
Contents: Subdivision
The population development in Bilecik as well as related information and services (Wikipedia, Google, images).
| Name | Status | Population Estimate 2009-12-31 | Population Estimate 2013-12-31 | Population Estimate 2017-12-31 | Population Estimate 2023-12-31 | |
|---|---|---|---|---|---|---|
| Bilecik | Province | 202,061 | 208,888 | 221,693 | 228,058 | |
| Bozüyük | District | 65,799 | 69,282 | 73,085 | 79,853 | → |
| Gölpazarı | District | 12,403 | 10,095 | 11,546 | 9,831 | → |
| İnhisar | District | 3,307 | 2,807 | 2,254 | 2,377 | → |
| Merkez | District | 62,823 | 71,072 | 80,065 | 82,416 | → |
| Osmaneli | District | 21,050 | 21,195 | 20,973 | 21,875 | → |
| Pazaryeri | District | 11,477 | 11,233 | 11,086 | 9,967 | → |
| Söğüt | District | 21,470 | 19,938 | 19,708 | 18,844 | → |
| Yenipazar | District | 3,732 | 3,266 | 2,976 | 2,895 | → |
| Türkiye [Turkey] | Republic | 72,561,312 | 76,667,864 | 80,810,525 | 85,372,377 |
Source: State Institute of Statistics, Republic of Türkiye.
Explanation: Area figures of districts are computed by using geospatial data.
Further information about the population structure:
| Gender (E 2023) | |
|---|---|
| Males | 115,418 |
| Females | 112,640 |
| Age Groups (E 2023) | |
|---|---|
| 0-14 years | 41,456 |
| 15-64 years | 157,856 |
| 65+ years | 28,746 |
| Age Distribution (E 2023) | |
|---|---|
| 90+ years | 850 |
| 80-89 years | 5,186 |
| 70-79 years | 12,163 |
| 60-69 years | 23,449 |
| 50-59 years | 28,496 |
| 40-49 years | 32,830 |
| 30-39 years | 33,134 |
| 20-29 years | 34,657 |
| 10-19 years | 30,272 |
| 0-9 years | 27,021 |