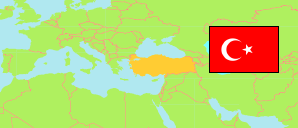
Bursa
Metropolitan Province in Turkey
Contents: Subdivision
The population development in Bursa as well as related information and services (Wikipedia, Google, images).
| Name | Status | Population Estimate 2009-12-31 | Population Estimate 2013-12-31 | Population Estimate 2017-12-31 | Population Estimate 2023-12-31 | |
|---|---|---|---|---|---|---|
| Bursa | Metropolitan Province | 2,550,645 | 2,740,970 | 2,936,803 | 3,214,571 | |
| Büyükorhan | District | 13,244 | 11,913 | 10,041 | 10,325 | → |
| Gemlik | District | 99,234 | 101,389 | 109,494 | 122,171 | → |
| Gürsu | District | 55,155 | 68,872 | 84,880 | 103,770 | → |
| Harmancık | District | 7,994 | 7,091 | 6,491 | 6,334 | → |
| İnegöl | District | 215,375 | 236,168 | 257,931 | 299,203 | → |
| İznik | District | 44,756 | 43,287 | 42,616 | 44,988 | → |
| Karacabey | District | 78,824 | 80,527 | 82,408 | 85,765 | → |
| Keles | District | 15,242 | 13,639 | 11,990 | 11,321 | → |
| Kestel | District | 47,709 | 51,872 | 60,720 | 75,954 | → |
| Mudanya | District | 68,954 | 77,461 | 90,282 | 109,964 | → |
| Mustafakemalpaşa | District | 101,800 | 99,999 | 99,972 | 103,944 | → |
| Nilüfer | District | 282,991 | 358,265 | 424,909 | 543,934 | → |
| Orhaneli | District | 23,992 | 22,175 | 19,503 | 19,527 | → |
| Orhangazi | District | 75,127 | 75,672 | 78,048 | 81,862 | → |
| Osmangazi | District | 765,728 | 802,620 | 856,770 | 885,273 | → |
| Yenişehir | District | 51,420 | 52,132 | 53,228 | 55,745 | → |
| Yıldırım | District | 603,100 | 637,888 | 647,520 | 654,491 | → |
| Türkiye [Turkey] | Republic | 72,561,312 | 76,667,864 | 80,810,525 | 85,372,377 |
Source: State Institute of Statistics, Republic of Türkiye.
Explanation: Area figures of districts are computed by using geospatial data.
Further information about the population structure:
| Gender (E 2023) | |
|---|---|
| Males | 1,605,941 |
| Females | 1,608,630 |
| Age Groups (E 2023) | |
|---|---|
| 0-14 years | 655,783 |
| 15-64 years | 2,223,800 |
| 65+ years | 334,988 |
| Age Distribution (E 2023) | |
|---|---|
| 90+ years | 7,178 |
| 80-89 years | 49,997 |
| 70-79 years | 149,030 |
| 60-69 years | 288,973 |
| 50-59 years | 399,282 |
| 40-49 years | 505,311 |
| 30-39 years | 489,433 |
| 20-29 years | 451,562 |
| 10-19 years | 448,070 |
| 0-9 years | 425,735 |
