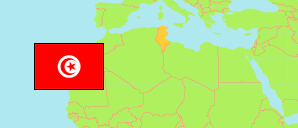
Manouba
Governorate in Tunisia
Contents: Subdivision
The population development in Manouba as well as related information and services (Wikipedia, Google, images).
| Name | Status | Native | Population Census 2004-04-28 | Population Census 2014-04-23 | Population Estimate 2023-01-01 | |
|---|---|---|---|---|---|---|
| Manouba | Governorate | منوبة | 335,912 | 379,518 | 426,525 | |
| Borj El Amri | Municipality | برج العامري | 16,184 | 17,408 | 19,072 | → |
| Den Den | Municipality | الدندان | 24,732 | 26,787 | 30,293 | → |
| Djedeida | Municipality | الجديدة | 40,327 | 44,748 | 50,507 | → |
| Douar Hicher | Municipality | دوار هيشر | 75,959 | 84,090 | 93,254 | → |
| El Bassatine | Municipality | البساتين | 12,932 | 13,701 | 15,978 | → |
| El Batan | Municipality | البطان | 17,321 | 18,977 | 20,929 | → |
| Manouba | Municipality | منوبة | 26,666 | 32,005 | 36,194 | → |
| Mornaguia | Municipality | المرناقية | ... | 28,986 | 33,804 | → |
| Oued Ellil | Municipality | وادي الليل | 58,544 | 69,317 | 79,209 | → |
| Tebourba | Municipality | طبربة | 41,050 | 43,499 | 47,284 | → |
| Tunisie [Tunisia] | Republic | تونس | 9,910,872 | 10,982,754 | 11,850,232 |
Source: Institut National de la Statistique Tunisie.
Explanation: Municipalities take the 2015-17 municipal boundary reform and further changes into account. Area figures are computed using geospatial data.