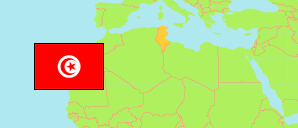
El Jem
Delegation in Tunisia
Contents: Population
The population development of El Jem as well as related information and services (Wikipedia, Google, images).
| Name | Status | Native | Population Census 2004-04-28 | Population Census 2014-04-23 | Population Estimate 2023-01-01 | |
|---|---|---|---|---|---|---|
| El Jem | Delegation | الجم | 41,064 | 48,611 | 56,497 | |
| Tunisie [Tunisia] | Republic | تونس | 9,910,872 | 10,982,754 | 11,850,232 |
Source: Institut National de la Statistique Tunisie.
Explanation: Delegations in 2023 boundaries. Area figures are computed using geospatial data.
Further information about the population structure:
| Gender (C 2014) | |
|---|---|
| Males | 24,132 |
| Females | 24,479 |
| Age Groups (C 2014) | |
|---|---|
| 0-14 years | 13,029 |
| 15-60 years | 30,548 |
| 60+ years | 5,034 |
| Age Distribution (C 2014) | |
|---|---|
| 0-9 years | 9,196 |
| 10-19 years | 7,989 |
| 20-29 years | 8,867 |
| 30-39 years | 7,418 |
| 40-49 years | 5,682 |
| 50-59 years | 4,425 |
| 60+ years | 5,034 |
| Urbanization (C 2014) | |
|---|---|
| Rural | 27,067 |
| Urban | 21,544 |