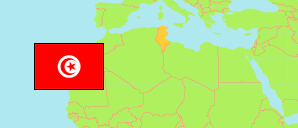
Sfax
Governorate in Tunisia
Contents: Subdivision
The population development in Sfax as well as related information and services (Wikipedia, Google, images).
| Name | Status | Native | Population Census 2004-04-28 | Population Census 2014-04-23 | Population Estimate 2023-01-01 | |
|---|---|---|---|---|---|---|
| Sfax | Governorate | صفاقس | 855,256 | 955,421 | 1,028,364 | |
| Agareb | Delegation | عقارب | 35,841 | 40,943 | 44,187 | → |
| Bir Ali Ben Khalifa [Bir Ali Ben Khélifa] | Delegation | بئر علي بن خليفة | 50,059 | 52,678 | 54,423 | → |
| El Amra | Delegation | العامرة | 28,723 | 30,599 | 31,900 | → |
| El Hencha | Delegation | الحنشة | 43,170 | 49,223 | 53,297 | → |
| Graïba [Ghraïba] | Delegation | الغريبة | 14,647 | 15,776 | 16,617 | → |
| Jebiniana | Delegation | جبنيانة | 44,029 | 49,678 | 53,382 | → |
| Kerkennah | Delegation | قرقنة | 14,400 | 15,501 | 16,439 | → |
| Mahrès | Delegation | المحرس | 30,676 | 34,257 | 36,519 | → |
| Menzel Chaker | Delegation | منزل شاكر | 34,119 | 37,368 | 39,344 | → |
| Sakiet Eddaïer | Delegation | ساقية الدائر | 98,988 | 113,776 | 125,254 | → |
| Sakiet Ezzit | Delegation | ساقية الزيت | 72,481 | 87,512 | 98,947 | → |
| Sfax Ouest | Delegation | صفاقس الغريبة | 104,998 | 110,125 | 113,419 | → |
| Sfax Sud | Delegation | صفاقس الجنوبية | 101,904 | 119,139 | 131,616 | → |
| Sfax Ville | Delegation | صفاقس المدينة | 105,958 | 101,176 | 96,964 | → |
| Skhira | Delegation | الصخيرة | 29,616 | 34,673 | 38,404 | → |
| Thyna | Delegation | طينة | 45,647 | 62,997 | 77,652 | → |
| Tunisie [Tunisia] | Republic | تونس | 9,910,872 | 10,982,754 | 11,850,232 |
Source: Institut National de la Statistique Tunisie.
Explanation: Delegations in 2023 boundaries. Area figures are computed using geospatial data.
Further information about the population structure:
| Gender (C 2014) | |
|---|---|
| Males | 480,700 |
| Females | 474,721 |
| Age Groups (C 2014) | |
|---|---|
| 0-14 years | 230,732 |
| 15-60 years | 616,146 |
| 60+ years | 108,543 |
| Age Distribution (C 2014) | |
|---|---|
| 0-9 years | 162,589 |
| 10-19 years | 140,699 |
| 20-29 years | 166,344 |
| 30-39 years | 148,598 |
| 40-49 years | 124,559 |
| 50-59 years | 104,089 |
| 60+ years | 108,543 |
| Urbanization (C 2014) | |
|---|---|
| Rural | 359,693 |
| Urban | 595,728 |