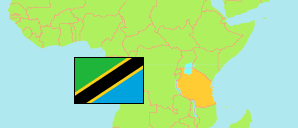
Tabora Municipal
Municipality in Tanzania
Contents: Population
The population development of Tabora Municipal as well as related information and services (Wikipedia, Google, images).
| Name | Status | Population Census 1988-08-27 | Population Census 2002-08-01 | Population Census 2012-08-26 | Population Census 2022-08-23 | |
|---|---|---|---|---|---|---|
| Tabora Municipal | Municipality | 143,148 | 188,005 | 226,999 | 308,741 | |
| Tanzania | United Republic | 23,174,336 | 34,443,603 | 44,928,923 | 61,741,120 |
Source: National Bureau of Statistics Tanzania.
Explanation: Area figures of districts are calculated from geospatial data.
Further information about the population structure:
| Gender (C 2022) | |
|---|---|
| Males | 150,416 |
| Females | 158,325 |
| Urbanization (C 2022) | |
|---|---|
| Rural | 87,275 |
| Urban | 221,466 |
| Age Groups (C 2022) | |
|---|---|
| 0-14 years | 122,264 |
| 15-64 years | 175,767 |
| 65+ years | 10,710 |
| Age Distribution (C 2022) | |
|---|---|
| 80+ years | 2,880 |
| 70-79 years | 4,503 |
| 60-69 years | 8,626 |
| 50-59 years | 14,050 |
| 40-49 years | 24,012 |
| 30-39 years | 38,524 |
| 20-29 years | 60,337 |
| 10-19 years | 70,856 |
| 0-9 years | 84,953 |