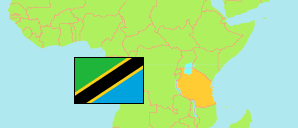
Tabora
Region in Tanzania
Contents: Subdivision
The population development in Tabora as well as related information and services (Wikipedia, Google, images).
| Name | Status | Population Census 1988-08-27 | Population Census 2002-08-01 | Population Census 2012-08-26 | Population Census 2022-08-23 | |
|---|---|---|---|---|---|---|
| Tabora | Region | 1,036,150 | 1,710,465 | 2,291,623 | 3,391,679 | |
| Igunga | District | 203,367 | 324,094 | 399,727 | 546,204 | → |
| Kaliua | District | ... | ... | 393,358 | 678,447 | → |
| Nzega Rural | District | ... | 348,376 | 414,392 | 574,498 | → |
| Nzega Town (← Nzega Rural) | Town | ... | 66,827 | 87,860 | 125,193 | → |
| Sikonge | District | 78,633 | 132,733 | 179,883 | 335,686 | → |
| Tabora Municipal | Municipality | 143,148 | 188,005 | 226,999 | 308,741 | → |
| Urambo | District | ... | ... | 192,781 | 260,322 | → |
| Uyui | District | 126,836 | 281,101 | 396,623 | 562,588 | → |
| Tanzania | United Republic | 23,174,336 | 34,443,603 | 44,928,923 | 61,741,120 |
Source: National Bureau of Statistics Tanzania.
Explanation: Area figures of districts are calculated from geospatial data.
Further information about the population structure:
| Gender (C 2022) | |
|---|---|
| Males | 1,661,171 |
| Females | 1,730,508 |
| Urbanization (C 2022) | |
|---|---|
| Rural | 2,888,034 |
| Urban | 503,645 |
| Age Groups (C 2022) | |
|---|---|
| 0-14 years | 1,668,025 |
| 15-64 years | 1,617,088 |
| 65+ years | 106,566 |
| Age Distribution (C 2022) | |
|---|---|
| 80+ years | 31,058 |
| 70-79 years | 45,984 |
| 60-69 years | 80,193 |
| 50-59 years | 132,758 |
| 40-49 years | 218,469 |
| 30-39 years | 337,811 |
| 20-29 years | 530,144 |
| 10-19 years | 832,314 |
| 0-9 years | 1,182,948 |