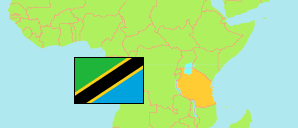
Singida
Region in Tanzania
Contents: Subdivision
The population development in Singida as well as related information and services (Wikipedia, Google, images).
| Name | Status | Population Census 1988-08-27 | Population Census 2002-08-01 | Population Census 2012-08-26 | Population Census 2022-08-23 | |
|---|---|---|---|---|---|---|
| Singida | Region | 792,387 | 1,086,748 | 1,370,637 | 2,008,058 | |
| Ikungi | District | ... | ... | 272,959 | 411,262 | → |
| Iramba | District | ... | ... | 236,282 | 328,912 | → |
| Itigi (← Manyoni) | District | ... | ... | 112,565 | 215,947 | → |
| Manyoni | District | ... | ... | 184,198 | 279,069 | → |
| Mkalama | District | ... | ... | 188,733 | 255,514 | → |
| Singida Municipal | Municipality | 81,528 | 114,853 | 150,379 | 232,459 | → |
| Singida Rural | District | ... | ... | 225,521 | 284,895 | → |
| Tanzania | United Republic | 23,174,336 | 34,443,603 | 44,928,923 | 61,741,120 |
Source: National Bureau of Statistics Tanzania.
Explanation: Area figures of districts are calculated from geospatial data.
Further information about the population structure:
| Gender (C 2022) | |
|---|---|
| Males | 995,703 |
| Females | 1,012,355 |
| Urbanization (C 2022) | |
|---|---|
| Rural | 1,686,020 |
| Urban | 322,038 |
| Age Groups (C 2022) | |
|---|---|
| 0-14 years | 942,655 |
| 15-64 years | 974,227 |
| 65+ years | 91,176 |
| Age Distribution (C 2022) | |
|---|---|
| 80+ years | 27,962 |
| 70-79 years | 39,307 |
| 60-69 years | 62,743 |
| 50-59 years | 102,246 |
| 40-49 years | 146,846 |
| 30-39 years | 200,324 |
| 20-29 years | 286,233 |
| 10-19 years | 483,611 |
| 0-9 years | 658,786 |