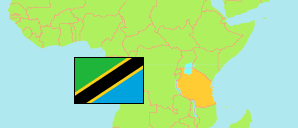
Pwani
Region in Tanzania
Contents: Subdivision
The population development in Pwani as well as related information and services (Wikipedia, Google, images).
| Name | Status | Population Census 1988-08-27 | Population Census 2002-08-01 | Population Census 2012-08-26 | Population Census 2022-08-23 | |
|---|---|---|---|---|---|---|
| Pwani | Region | 636,103 | 885,017 | 1,098,668 | 2,024,947 | |
| Bagamoyo | District | ... | ... | 97,660 | 205,478 | → |
| Chalinze (← Bagamoyo) | District | ... | ... | 214,080 | 316,759 | → |
| Kibaha | District | ... | ... | 70,209 | 123,367 | → |
| Kibaha Town | Town | ... | ... | 128,488 | 265,360 | → |
| Kibiti (← Rufiji) | District | ... | ... | 117,752 | 195,638 | → |
| Kisarawe | District | 78,290 | 95,323 | 101,598 | 159,226 | → |
| Mafia | District | 33,079 | 40,557 | 46,438 | 66,180 | → |
| Mkuranga | District | 114,973 | 186,927 | 222,921 | 533,033 | → |
| Rufiji | District | ... | ... | 99,522 | 159,906 | → |
| Tanzania | United Republic | 23,174,336 | 34,443,603 | 44,928,923 | 61,741,120 |
Source: National Bureau of Statistics Tanzania.
Explanation: Area figures of districts are calculated from geospatial data.
Further information about the population structure:
| Gender (C 2022) | |
|---|---|
| Males | 998,616 |
| Females | 1,026,331 |
| Urbanization (C 2022) | |
|---|---|
| Rural | 1,188,752 |
| Urban | 836,195 |
| Age Groups (C 2022) | |
|---|---|
| 0-14 years | 761,525 |
| 15-64 years | 1,175,494 |
| 65+ years | 87,928 |
| Age Distribution (C 2022) | |
|---|---|
| 80+ years | 26,966 |
| 70-79 years | 36,742 |
| 60-69 years | 64,724 |
| 50-59 years | 110,215 |
| 40-49 years | 191,848 |
| 30-39 years | 278,635 |
| 20-29 years | 358,553 |
| 10-19 years | 427,114 |
| 0-9 years | 530,150 |