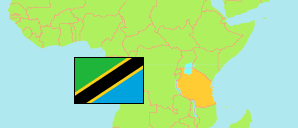
Kilimanjaro
Region in Tanzania
Contents: Subdivision
The population development in Kilimanjaro as well as related information and services (Wikipedia, Google, images).
| Name | Status | Population Census 1988-08-27 | Population Census 2002-08-01 | Population Census 2012-08-26 | Population Census 2022-08-23 | |
|---|---|---|---|---|---|---|
| Kilimanjaro | Region | 1,104,673 | 1,376,702 | 1,640,087 | 1,861,934 | |
| Hai | District | ... | ... | 210,533 | 240,999 | → |
| Moshi Municipal | Municipality | 96,631 | 143,799 | 184,292 | 221,733 | → |
| Moshi Rural | District | 342,891 | 401,369 | 466,737 | 535,803 | → |
| Mwanga | District | 97,003 | 115,145 | 131,442 | 148,763 | → |
| Rombo | District | 200,912 | 245,716 | 260,963 | 275,314 | → |
| Same | District | 169,718 | 211,738 | 269,807 | 300,303 | → |
| Siha | District | ... | ... | 116,313 | 139,019 | → |
| Tanzania | United Republic | 23,174,336 | 34,443,603 | 44,928,923 | 61,741,120 |
Source: National Bureau of Statistics Tanzania.
Explanation: Area figures of districts are calculated from geospatial data.
Further information about the population structure:
| Gender (C 2022) | |
|---|---|
| Males | 907,636 |
| Females | 954,298 |
| Urbanization (C 2022) | |
|---|---|
| Rural | 1,419,512 |
| Urban | 442,422 |
| Age Groups (C 2022) | |
|---|---|
| 0-14 years | 654,298 |
| 15-64 years | 1,071,790 |
| 65+ years | 135,846 |
| Age Distribution (C 2022) | |
|---|---|
| 80+ years | 37,819 |
| 70-79 years | 56,791 |
| 60-69 years | 99,830 |
| 50-59 years | 143,577 |
| 40-49 years | 178,877 |
| 30-39 years | 212,872 |
| 20-29 years | 298,460 |
| 10-19 years | 388,284 |
| 0-9 years | 445,424 |