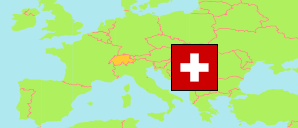
Altdorf (UR)
Agglomeration in Switzerland
Contents: Population
The population development of Altdorf (UR) as well as related information and services (Wikipedia, Google, images).
| Name | Status | Cantons | Population Census 1980-12-02 | Population Census 1990-12-04 | Population Census 2000-12-05 | Population Estimate 2010-12-31 | Population Estimate 2020-12-31 | Population Estimate 2023-12-31 | |
|---|---|---|---|---|---|---|---|---|---|
| Altdorf (UR) | Agglomeration | Uri | 28,919 | 29,800 | 30,594 | 31,307 | 32,545 | 33,485 |
Source: Swiss Federal Statistical Office.
Explanation: Boundaries of agglomerations (core and belt) according to the 2012 definition without parts outside of Switzerland. The population figures for 2023 are preliminary.
Further information about the population structure:
| Gender (E 2022) | |
|---|---|
| Males | 16,693 |
| Females | 16,300 |
| Age Groups (E 2022) | |
|---|---|
| 0-17 years | 6,050 |
| 18-64 years | 19,904 |
| 65+ years | 7,039 |
| Age Distribution (E 2022) | |
|---|---|
| 90+ years | 342 |
| 80-89 years | 1,591 |
| 70-79 years | 3,159 |
| 60-69 years | 4,242 |
| 50-59 years | 4,739 |
| 40-49 years | 4,164 |
| 30-39 years | 4,204 |
| 20-29 years | 3,827 |
| 10-19 years | 3,457 |
| 0-9 years | 3,268 |
| Citizenship (E 2022) | |
|---|---|
| Switzerland | 28,866 |
| Germany | 688 |
| France | 21 |
| Italy | 378 |
| Portugal | 696 |
| EU (others) | 778 |
| Europe (non-EU countries) | 660 |
| Africa | 294 |
| Asia | 505 |
| Other country | 98 |
| Country of Birth (E 2022) | |
|---|---|
| Switzerland | 28,295 |
| Other country | 4,698 |