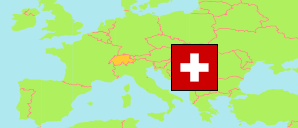
Fribourg
Canton in Switzerland
Contents: Subdivision
The population development in Fribourg as well as related information and services (Wikipedia, Google, images).
| Name | Status | Population Census 1980-12-02 | Population Census 1990-12-04 | Population Census 2000-12-05 | Population Estimate 2010-12-31 | Population Estimate 2020-12-31 | Population Estimate 2023-12-31 | |
|---|---|---|---|---|---|---|---|---|
| Fribourg (Freiburg) | Canton | 185,300 | 213,627 | 241,759 | 278,541 | 325,547 | 341,490 | |
| Bezirk See / District du Lac [Lake District] | District | 19,986 | 23,072 | 28,228 | 32,959 | 37,746 | 39,288 | → |
| Bezirk Sense | District | 29,613 | 33,805 | 38,299 | 41,113 | 44,594 | 46,073 | → |
| District de la Broye | District | 15,859 | 18,552 | 21,309 | 26,525 | 33,901 | 35,863 | → |
| District de la Glâne | District | 13,829 | 16,209 | 17,774 | 20,708 | 24,957 | 26,510 | → |
| District de la Gruyère | District | 27,905 | 33,080 | 38,070 | 46,415 | 57,619 | 61,437 | → |
| District de la Sarine | District | 69,411 | 78,306 | 85,465 | 94,849 | 107,158 | 111,138 | → |
| District de la Veveyse | District | 8,697 | 10,603 | 12,614 | 15,972 | 19,572 | 21,181 | → |
| Schweiz (Suisse, Svizzera, Svizra, Helvetia) [Switzerland] | Confederation | 6,365,960 | 6,873,687 | 7,288,010 | 7,870,134 | 8,670,300 | 8,960,817 |
Source: Swiss Federal Statistical Office.
Explanation: The population figures for 2023 are preliminary.
Further information about the population structure:
| Gender (E 2022) | |
|---|---|
| Males | 167,569 |
| Females | 166,896 |
| Age Groups (E 2022) | |
|---|---|
| 0-17 years | 65,853 |
| 18-64 years | 212,994 |
| 65+ years | 55,618 |
| Age Distribution (E 2022) | |
|---|---|
| 90+ years | 2,296 |
| 80-89 years | 11,734 |
| 70-79 years | 25,608 |
| 60-69 years | 36,211 |
| 50-59 years | 49,128 |
| 40-49 years | 45,718 |
| 30-39 years | 47,859 |
| 20-29 years | 42,793 |
| 10-19 years | 36,463 |
| 0-9 years | 36,655 |
| Citizenship (E 2022) | |
|---|---|
| Switzerland | 255,175 |
| Germany | 3,003 |
| France | 12,000 |
| Italy | 5,554 |
| Portugal | 25,843 |
| EU (others) | 9,682 |
| Europe (non-EU countries) | 11,233 |
| Africa | 5,022 |
| Asia | 4,701 |
| Other country | 2,220 |
| Country of Birth (E 2022) | |
|---|---|
| Switzerland | 248,237 |
| Other country | 86,228 |