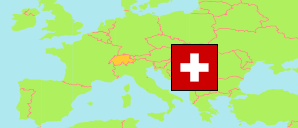
Glarus
Canton in Switzerland
Contents: Subdivision
The population development in Glarus as well as related information and services (Wikipedia, Google, images).
| Name | Status | Population Census 1980-12-02 | Population Census 1990-12-04 | Population Census 2000-12-05 | Population Estimate 2010-12-31 | Population Estimate 2020-12-31 | Population Estimate 2023-12-31 | |
|---|---|---|---|---|---|---|---|---|
| Glarus | Canton | 36,718 | 38,508 | 38,183 | 38,608 | 40,851 | 42,053 | |
| Glarus | Canton | 36,718 | 38,508 | 38,183 | 38,608 | 40,851 | 42,053 | → |
| Schweiz (Suisse, Svizzera, Svizra, Helvetia) [Switzerland] | Confederation | 6,365,960 | 6,873,687 | 7,288,010 | 7,870,134 | 8,670,300 | 8,960,817 |
Source: Swiss Federal Statistical Office.
Explanation: The population figures for 2023 are preliminary.
Further information about the population structure:
| Gender (E 2022) | |
|---|---|
| Males | 20,975 |
| Females | 20,496 |
| Age Groups (E 2022) | |
|---|---|
| 0-17 years | 7,206 |
| 18-64 years | 25,520 |
| 65+ years | 8,745 |
| Age Distribution (E 2022) | |
|---|---|
| 90+ years | 446 |
| 80-89 years | 1,959 |
| 70-79 years | 3,867 |
| 60-69 years | 5,465 |
| 50-59 years | 6,046 |
| 40-49 years | 5,427 |
| 30-39 years | 5,738 |
| 20-29 years | 4,555 |
| 10-19 years | 3,866 |
| 0-9 years | 4,102 |
| Citizenship (E 2022) | |
|---|---|
| Switzerland | 30,918 |
| Germany | 1,496 |
| France | 28 |
| Italy | 1,816 |
| Portugal | 1,326 |
| EU (others) | 1,792 |
| Europe (non-EU countries) | 2,675 |
| Africa | 330 |
| Asia | 910 |
| Other country | 175 |
| Country of Birth (E 2022) | |
|---|---|
| Switzerland | 30,788 |
| Other country | 10,683 |