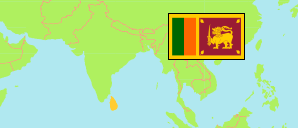
Badulla
District in Sri Lanka
Contents: Population
The population development of Badulla as well as related information and services (Wikipedia, Google, images).
| Name | Status | Population Census 1981-03-17 | Population Census 2001-07-17 | Population Census 2012-03-20 | Population Census 2024-12-19 | |
|---|---|---|---|---|---|---|
| Badulla | District | 640,952 | 779,983 | 815,405 | 872,307 | |
| Sri Lanka | Republic | 14,846,750 | 18,797,257 | 20,359,439 | 21,781,800 |
Source: Department of Census and Statistics, Sri Lanka.
Further information about the population structure:
| Gender (C 2024) | |
|---|---|
| Males | 422,818 |
| Females | 449,489 |
| Age Groups (C 2024) | |
|---|---|
| 0-14 years | 188,030 |
| 15-64 years | 579,498 |
| 65+ years | 104,779 |
| Ethnic Group (C 2024) | |
|---|---|
| Sinhalese | 640,625 |
| Sri Lankan Tamil | 81,854 |
| Indian Tamil | 95,686 |
| Sri Lankan Moor | 52,188 |
| Other ethnic group | 1,954 |
| Religion (C 2024) | |
|---|---|
| Buddhists | 636,988 |
| Hindus | 166,380 |
| Muslims | 53,563 |
| Christians | 15,322 |
| Other religion | 54 |