
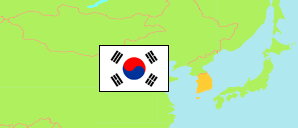
Goheung-gun
County in South Jeolla Province
Contents: Subdivision
The population development in Goheung-gun as well as related information and services (Wikipedia, Google, images).
 icon links to further information about a selected division including its population structure (gender, age groups, age distribution, citizenship).
| Name | Status | Native | Population Census 2005-11-01 | Population Census 2010-11-01 | Population Census 2015-11-01 | Population Census 2020-11-01 | |
|---|---|---|---|---|---|---|---|
| Goheung-gun | County | 고흥군 | 72,700 | 63,392 | 62,477 | 60,045 | |
| Bongnae-myeon | Rural Township | 봉래면 | 2,267 | 1,993 | 1,919 | 1,796 | → |
| Daeseo-myeon | Rural Township | 대서면 | 2,683 | 2,319 | 2,288 | 2,109 | → |
| Dodeok-myeon | Rural Township | 도덕면 | 3,400 | 3,066 | 2,981 | 2,798 | → |
| Dohwa-myeon | Rural Township | 도화면 | 5,308 | 4,161 | 4,026 | 3,806 | → |
| Donggang-myeon | Rural Township | 동강면 | 3,617 | 3,180 | 3,046 | 2,862 | → |
| Dongil-myeon | Rural Township | 동일면 | 1,626 | 1,442 | 1,490 | 1,418 | → |
| Doyang-eup | Town | 도양읍 | 11,705 | 10,316 | 10,356 | 10,127 | → |
| Duwon-myeon | Rural Township | 두원면 | 3,486 | 3,172 | 3,024 | 2,848 | → |
| Geumsan-myeon | Rural Township | 금산면 | 4,979 | 4,299 | 4,285 | 4,026 | → |
| Goheung-eup | Town | 고흥읍 | 12,384 | 11,174 | 11,548 | 12,043 | → |
| Gwayeok-myeon | Rural Township | 과역면 | 4,363 | 3,340 | 3,237 | 3,060 | → |
| Jeomam-myeon | Rural Township | 점암면 | 3,087 | 2,764 | 2,641 | 2,417 | → |
| Namyang-myeon | Rural Township | 남양면 | 3,037 | 2,482 | 2,368 | 2,163 | → |
| Podu-myeon | Rural Township | 포두면 | 5,475 | 4,842 | 4,687 | 4,457 | → |
| Pungyang-myeon | Rural Township | 풍양면 | 3,750 | 3,319 | 3,219 | 2,889 | → |
| Yeongnam-myeon | Rural Township | 영남면 | 1,533 | 1,523 | 1,362 | 1,226 | → |
| Jeollanam-do [South Jeolla] | Province | 전라남도 | 1,819,819 | 1,741,499 | 1,799,044 | 1,788,807 |
Source: National Statistical Office of the Republic of Korea (web).
Explanation: Since 2015, a register-based census is performed. Nevertheless, the results are not consistent with the population figures from the resident registration that are higher by about 3.5% on average. Area figures are derived from geospatial data.
Further information about the population structure:
| Gender (C 2020) | |
|---|---|
| Males | 29,349 |
| Females | 30,696 |
| Age Groups (C 2020) | |
|---|---|
| 0-14 years | 4,179 |
| 15-64 years | 31,217 |
| 65+ years | 24,649 |
| Age Distribution (C 2020) | |
|---|---|
| 90+ years | 1,092 |
| 80-89 years | 6,899 |
| 70-79 years | 10,922 |
| 60-69 years | 12,039 |
| 50-59 years | 9,564 |
| 40-49 years | 5,997 |
| 30-39 years | 3,818 |
| 20-29 years | 3,846 |
| 10-19 years | 3,316 |
| 0-9 years | 2,552 |
| Citizenship (C 2020) | |
|---|---|
| Korea | 58,680 |
| Foreign Citizenship | 1,365 |