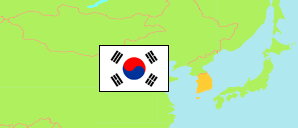
Cheongyang-gun
County in South Chungcheong Province
Contents: Subdivision
The population development in Cheongyang-gun as well as related information and services (Wikipedia, Google, images).
| Name | Status | Native | Population Census 2005-11-01 | Population Census 2010-11-01 | Population Census 2015-11-01 | Population Census 2020-11-01 | |
|---|---|---|---|---|---|---|---|
| Cheongyang-gun | County | 청양군 | 31,316 | 29,755 | 31,653 | 30,103 | |
| Bibong-myeon | Rural Township | 비봉면 | 2,263 | 2,012 | 2,126 | 2,019 | → |
| Cheongnam-myeon | Rural Township | 청남면 | 2,030 | 1,899 | 2,016 | 1,909 | → |
| Cheongyang-eup | Town | 청양읍 | 9,868 | 9,960 | 10,784 | 10,056 | → |
| Daechi-myeon | Rural Township | 대치면 | 2,144 | 1,949 | 2,083 | 2,133 | → |
| Hwaseong-myeon | Rural Township | 화성면 | 2,300 | 2,126 | 2,225 | 2,107 | → |
| Jangpyeong-myeon | Rural Township | 장평면 | 2,453 | 2,331 | 2,486 | 2,240 | → |
| Jeongsan-myeon | Rural Township | 정산면 | 3,842 | 3,418 | 3,564 | 3,460 | → |
| Mok-myeon | Rural Township | 목면 | 1,557 | 1,455 | 1,509 | 1,416 | → |
| Namyang-myeon | Rural Township | 남양면 | 2,762 | 2,515 | 2,653 | 2,627 | → |
| Ungok-myeon | Rural Township | 운곡면 | 2,097 | 2,090 | 2,207 | 2,136 | → |
| Chungcheongnam-do [South Chungcheong] | Province | 충청남도 | 1,808,677 | 1,946,555 | 2,107,802 | 2,176,636 |
Source: National Statistical Office of the Republic of Korea (web).
Explanation: Since 2015, a register-based census is performed. Nevertheless, the results are not consistent with the population figures from the resident registration that are higher by about 3.5% on average. Area figures are derived from geospatial data.
Further information about the population structure:
| Gender (C 2020) | |
|---|---|
| Males | 15,202 |
| Females | 14,901 |
| Age Groups (C 2020) | |
|---|---|
| 0-14 years | 2,084 |
| 15-64 years | 17,408 |
| 65+ years | 10,611 |
| Age Distribution (C 2020) | |
|---|---|
| 90+ years | 396 |
| 80-89 years | 3,133 |
| 70-79 years | 4,430 |
| 60-69 years | 5,928 |
| 50-59 years | 5,180 |
| 40-49 years | 3,049 |
| 30-39 years | 2,234 |
| 20-29 years | 2,615 |
| 10-19 years | 1,891 |
| 0-9 years | 1,247 |
| Citizenship (C 2020) | |
|---|---|
| Korea | 29,229 |
| Foreign Citizenship | 874 |