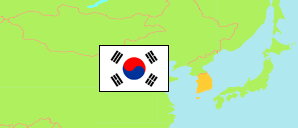
Jung-gu
City District in Daejeon (South Korea)
Contents: Population
The population development of Jung-gu as well as related information and services (Wikipedia, Google, images).
| Name | Status | Native | Population Census 1980-11-01 | Population Census 1990-11-01 | Population Census 2000-11-01 | Population Census 2010-11-01 | Population Census 2015-11-01 | Population Census 2020-11-01 | |
|---|---|---|---|---|---|---|---|---|---|
| Jung-gu [Central District] | City District | 중구 | 288,808 | 296,942 | 253,990 | 255,486 | 250,434 | 231,959 | |
| Daehan Minguk [South Korea] | Republic | 대한민국 | 37,436,315 | 43,410,899 | 46,136,101 | 48,580,293 | 51,069,375 | 51,829,136 |
Source: National Statistical Office of the Republic of Korea (web).
Explanation: Since 2015, a register-based census is performed. Nevertheless, the results are not consistent with the population figures from the resident registration that are higher by about 3.5% on average.
Further information about the population structure:
| Gender (C 2020) | |
|---|---|
| Males | 113,814 |
| Females | 118,145 |
| Age Groups (C 2020) | |
|---|---|
| 0-14 years | 25,134 |
| 15-64 years | 161,572 |
| 65+ years | 45,253 |
| Age Distribution (C 2020) | |
|---|---|
| 90+ years | 1,255 |
| 80-89 years | 9,189 |
| 70-79 years | 20,517 |
| 60-69 years | 32,937 |
| 50-59 years | 38,873 |
| 40-49 years | 36,002 |
| 30-39 years | 26,052 |
| 20-29 years | 30,391 |
| 10-19 years | 21,535 |
| 0-9 years | 15,208 |
| Citizenship (C 2020) | |
|---|---|
| Korea | 229,936 |
| Foreign Citizenship | 2,023 |