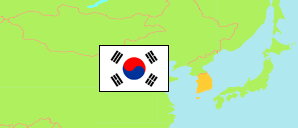
Jeollabuk-do
Province in South Korea
Contents: Subdivision
The population development in Jeollabuk-do as well as related information and services (Wikipedia, Google, images).
| Name | Status | Native | Population Census 1980-11-01 | Population Census 1990-11-01 | Population Census 2000-11-01 | Population Census 2010-11-01 | Population Census 2015-11-01 | Population Census 2020-11-01 | |
|---|---|---|---|---|---|---|---|---|---|
| Jeollabuk-do [North Jeolla] | Province | 전라북도 | 2,287,689 | 2,069,960 | 1,890,669 | 1,777,220 | 1,834,114 | 1,802,766 | |
| Buan-gun | County | 부안군 | 131,013 | 102,823 | 64,691 | 50,814 | 52,091 | 49,326 | → |
| Gimje-si | City | 김제시 | 193,188 | 149,791 | 102,589 | 83,302 | 84,269 | 79,733 | → |
| Gochang-gun | County | 고창군 | 144,961 | 95,732 | 64,936 | 53,333 | 55,665 | 52,608 | → |
| Gunsan-si | City | 군산시 | 271,175 | 287,055 | 272,715 | 260,546 | 275,155 | 269,023 | → |
| Iksan-si | City | 익산시 | 301,312 | 309,380 | 323,687 | 296,366 | 301,723 | 285,312 | → |
| Imsil-gun | County | 임실군 | 83,973 | 48,338 | 30,799 | 23,663 | 25,935 | 26,075 | → |
| Jangsu-gun | County | 장수군 | 57,820 | 34,172 | 23,316 | 19,424 | 21,620 | 20,879 | → |
| Jeongeup-si | City | 정읍시 | 220,950 | 185,323 | 129,152 | 110,352 | 110,627 | 106,706 | → |
| Jeonju-si | City | 전주시 | 387,645 | 517,059 | 616,468 | 649,728 | 658,172 | 666,517 | → |
| Jinan-gun | County | 진안군 | 78,485 | 44,755 | 30,276 | 20,446 | 22,886 | 23,380 | → |
| Muju-gun | County | 무주군 | 56,660 | 37,188 | 27,462 | 21,827 | 23,408 | 22,678 | → |
| Namwon-si | City | 남원시 | 155,088 | 124,524 | 94,926 | 78,770 | 80,499 | 78,097 | → |
| Sunchang-gun | County | 순창군 | 73,635 | 45,466 | 30,515 | 25,241 | 26,707 | 26,598 | → |
| Wanju-gun | County | 완주군 | 131,784 | 88,354 | 79,137 | 83,408 | 95,357 | 95,834 | → |
| Daehan Minguk [South Korea] | Republic | 대한민국 | 37,436,315 | 43,410,899 | 46,136,101 | 48,580,293 | 51,069,375 | 51,829,136 |
Source: National Statistical Office of the Republic of Korea (web).
Explanation: Since 2015, a register-based census is performed. Nevertheless, the results are not consistent with the population figures from the resident registration that are higher by about 3.5% on average.
Further information about the population structure:
| Gender (C 2020) | |
|---|---|
| Males | 899,058 |
| Females | 903,708 |
| Age Groups (C 2020) | |
|---|---|
| 0-14 years | 209,198 |
| 15-64 years | 1,217,575 |
| 65+ years | 375,993 |
| Age Distribution (C 2020) | |
|---|---|
| 90+ years | 13,286 |
| 80-89 years | 89,361 |
| 70-79 years | 166,546 |
| 60-69 years | 248,050 |
| 50-59 years | 293,187 |
| 40-49 years | 264,400 |
| 30-39 years | 195,528 |
| 20-29 years | 229,399 |
| 10-19 years | 174,226 |
| 0-9 years | 128,783 |
| Citizenship (C 2020) | |
|---|---|
| Korea | 1,760,400 |
| Foreign Citizenship | 42,366 |