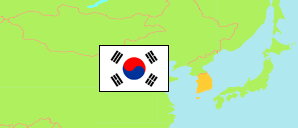
Gangwon-do
Province in South Korea
Contents: Subdivision
The population development in Gangwon-do as well as related information and services (Wikipedia, Google, images).
| Name | Status | Native | Population Census 1980-11-01 | Population Census 1990-11-01 | Population Census 2000-11-01 | Population Census 2010-11-01 | Population Census 2015-11-01 | Population Census 2020-11-01 | |
|---|---|---|---|---|---|---|---|---|---|
| Gangwon-do | Province | 강원도 | 1,790,954 | 1,580,430 | 1,487,011 | 1,471,513 | 1,518,040 | 1,521,763 | |
| Cheorwon-gun | County | 철원군 | 64,375 | 52,591 | 48,008 | 43,271 | 46,025 | 43,042 | → |
| Chuncheon-si | City | 춘천시 | 211,018 | 217,869 | 252,547 | 276,232 | 281,596 | 284,645 | → |
| Donghae-si | City | 동해시 | 104,310 | 89,162 | 96,679 | 90,574 | 90,255 | 87,801 | → |
| Gangneung-si | City | 강릉시 | 203,379 | 229,039 | 228,232 | 218,471 | 215,677 | 216,542 | → |
| Goseong-gun | County | 고성군 | 49,225 | 40,901 | 32,245 | 26,753 | 28,689 | 26,572 | → |
| Hoengseong-gun | County | 횡성군 | 71,483 | 48,489 | 40,990 | 37,798 | 42,669 | 44,649 | → |
| Hongcheon-gun | County | 홍천군 | 101,006 | 77,799 | 67,210 | 62,888 | 67,190 | 66,587 | → |
| Hwacheon-gun | County | 화천군 | 38,541 | 28,883 | 22,761 | 22,119 | 25,343 | 23,733 | → |
| Inje-gun | County | 인제군 | 47,766 | 36,603 | 30,807 | 28,765 | 31,219 | 30,147 | → |
| Jeongseon-gun | County | 정선군 | 133,843 | 88,377 | 46,080 | 35,980 | 36,701 | 34,524 | → |
| Pyeongchang-gun | County | 평창군 | 78,699 | 53,259 | 41,210 | 37,522 | 40,427 | 39,258 | → |
| Samcheok-si | City | 삼척시 | 139,627 | 110,557 | 75,647 | 67,454 | 69,509 | 65,939 | → |
| Sokcho-si | City | 속초시 | 65,792 | 73,805 | 87,985 | 80,791 | 79,846 | 80,054 | → |
| Taebaek-si | City | 태백시 | 111,825 | 89,779 | 54,196 | 51,558 | 46,715 | 41,494 | → |
| Wonju-si | City | 원주시 | 198,650 | 214,579 | 268,352 | 311,449 | 330,854 | 352,429 | → |
| Yanggu-gun | County | 양구군 | 33,689 | 28,495 | 21,165 | 19,363 | 22,497 | 21,317 | → |
| Yangyang-gun | County | 양양군 | 42,220 | 35,643 | 29,130 | 25,475 | 25,861 | 26,748 | → |
| Yeongwol-gun | County | 영월군 | 95,506 | 64,600 | 43,767 | 35,050 | 36,967 | 36,282 | → |
| Daehan Minguk [South Korea] | Republic | 대한민국 | 37,436,315 | 43,410,899 | 46,136,101 | 48,580,293 | 51,069,375 | 51,829,136 |
Source: National Statistical Office of the Republic of Korea (web).
Explanation: Since 2015, a register-based census is performed. Nevertheless, the results are not consistent with the population figures from the resident registration that are higher by about 3.5% on average.
Further information about the population structure:
| Gender (C 2020) | |
|---|---|
| Males | 767,674 |
| Females | 754,089 |
| Age Groups (C 2020) | |
|---|---|
| 0-14 years | 168,414 |
| 15-64 years | 1,044,372 |
| 65+ years | 308,977 |
| Age Distribution (C 2020) | |
|---|---|
| 90+ years | 10,740 |
| 80-89 years | 69,428 |
| 70-79 years | 132,736 |
| 60-69 years | 232,247 |
| 50-59 years | 260,716 |
| 40-49 years | 219,072 |
| 30-39 years | 167,324 |
| 20-29 years | 188,352 |
| 10-19 years | 136,053 |
| 0-9 years | 105,095 |
| Citizenship (C 2020) | |
|---|---|
| Korea | 1,497,109 |
| Foreign Citizenship | 24,654 |