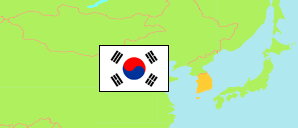
Seoul
Metropolitan City in South Korea
Contents: Subdivision
The population development in Seoul as well as related information and services (Wikipedia, Google, images).
| Name | Status | Native | Population Census 1980-11-01 | Population Census 1990-11-01 | Population Census 2000-11-01 | Population Census 2010-11-01 | Population Census 2015-11-01 | Population Census 2020-11-01 | |
|---|---|---|---|---|---|---|---|---|---|
| Seoul | Metropolitan City | 서울특별시 | 8,364,379 | 10,612,577 | 9,895,217 | 9,794,304 | 9,904,312 | 9,586,195 | |
| Dobong-gu | City District | 도봉구 | 182,595 | 305,841 | 352,702 | 348,625 | 340,095 | 315,979 | → |
| Dongdaemun-gu | City District | 동대문구 | 471,633 | 503,394 | 367,596 | 346,770 | 364,787 | 351,057 | → |
| Dongjak-gu | City District | 동작구 | 392,916 | 403,724 | 401,133 | 397,317 | 407,894 | 392,772 | → |
| Eunpyeong-gu | City District | 은평구 | 382,891 | 469,891 | 442,604 | 450,583 | 478,374 | 463,102 | → |
| Gangbuk-gu | City District | 강북구 | 348,449 | 365,954 | 340,765 | 324,413 | 319,992 | 299,535 | → |
| Gangdong-gu | City District | 강동구 | 235,334 | 532,436 | 474,244 | 465,958 | 444,385 | 444,434 | → |
| Gangnam-gu | City District | 강남구 | 236,748 | 491,062 | 523,350 | 527,641 | 541,688 | 508,135 | → |
| Gangseo-gu | City District | 강서구 | 271,689 | 391,139 | 504,480 | 546,938 | 570,507 | 564,854 | → |
| Geumcheon-gu | City District | 금천구 | 233,039 | 316,999 | 268,586 | 242,510 | 250,690 | 249,419 | → |
| Guro-gu | City District | 구로구 | 335,698 | 431,073 | 392,541 | 417,339 | 444,832 | 435,442 | → |
| Gwanak-gu | City District | 관악구 | 501,624 | 574,255 | 505,036 | 520,849 | 519,622 | 502,641 | → |
| Gwangjin-gu | City District | 광진구 | 283,128 | 384,413 | 381,568 | 368,021 | 368,199 | 353,967 | → |
| Jongno-gu | City District | 종로구 | 292,483 | 243,331 | 170,118 | 155,575 | 161,521 | 151,291 | → |
| Jung-gu [Central District] | City District | 중구 | 242,584 | 188,118 | 135,173 | 121,144 | 128,478 | 128,744 | → |
| Jungnang-gu | City District | 중랑구 | 376,448 | 448,390 | 440,863 | 403,105 | 403,237 | 385,663 | → |
| Mapo-gu | City District | 마포구 | 432,814 | 435,630 | 367,220 | 369,432 | 381,330 | 365,612 | → |
| Nowon-gu | City District | 노원구 | 222,258 | 480,004 | 606,394 | 587,248 | 562,996 | 511,982 | → |
| Seocho-gu | City District | 서초구 | 238,132 | 395,699 | 368,339 | 393,270 | 420,804 | 401,749 | → |
| Seodaemun-gu | City District | 서대문구 | 419,541 | 387,089 | 351,625 | 313,814 | 308,768 | 317,209 | → |
| Seongbuk-gu | City District | 성북구 | 588,759 | 551,540 | 460,511 | 457,570 | 456,844 | 438,833 | → |
| Seongdong-gu | City District | 성동구 | 404,579 | 414,626 | 325,251 | 296,135 | 295,006 | 291,918 | → |
| Songpa-gu | City District | 송파구 | 276,027 | 634,338 | 633,956 | 646,970 | 634,941 | 643,288 | → |
| Yangcheon-gu | City District | 양천구 | 229,493 | 490,500 | 459,643 | 469,434 | 465,512 | 439,068 | → |
| Yeongdeungpo-gu | City District | 영등포구 | 431,992 | 470,109 | 390,035 | 396,243 | 406,528 | 403,619 | → |
| Yongsan-gu | City District | 용산구 | 333,525 | 303,022 | 231,484 | 227,400 | 227,282 | 225,882 | → |
| Daehan Minguk [South Korea] | Republic | 대한민국 | 37,436,315 | 43,410,899 | 46,136,101 | 48,580,293 | 51,069,375 | 51,829,136 |
Source: National Statistical Office of the Republic of Korea (web).
Explanation: Since 2015, a register-based census is performed. Nevertheless, the results are not consistent with the population figures from the resident registration that are higher by about 3.5% on average.
Further information about the population structure:
| Gender (C 2020) | |
|---|---|
| Males | 4,647,733 |
| Females | 4,938,462 |
| Age Groups (C 2020) | |
|---|---|
| 0-14 years | 975,117 |
| 15-64 years | 7,111,630 |
| 65+ years | 1,499,448 |
| Age Distribution (C 2020) | |
|---|---|
| 90+ years | 35,332 |
| 80-89 years | 260,623 |
| 70-79 years | 682,604 |
| 60-69 years | 1,233,530 |
| 50-59 years | 1,517,399 |
| 40-49 years | 1,493,299 |
| 30-39 years | 1,480,069 |
| 20-29 years | 1,499,474 |
| 10-19 years | 761,790 |
| 0-9 years | 622,075 |
| Citizenship (C 2020) | |
|---|---|
| Korea | 9,219,741 |
| Foreign Citizenship | 366,454 |