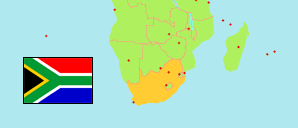
North West
Province in South Africa
Contents: Subdivision
The population development in North West as well as related information and services (Wikipedia, Google, images).
| Name | Status | Population Census 1996-10-09 | Population Census 2001-10-09 | Population Census 2011-10-09 | Population Census 2022-02-02 | |
|---|---|---|---|---|---|---|
| North West | Province | 2,726,828 | 2,982,064 | 3,509,953 | 3,804,548 | |
| City of Matlosana (City Council of Klerksdorp) | Local Municipality | 334,174 | 359,202 | 398,676 | 431,231 | → |
| Ditsobotla | Local Municipality | 129,915 | 147,455 | 168,902 | 164,176 | → |
| Greater Taung | Local Municipality | 184,364 | 182,164 | 177,642 | 202,009 | → |
| JB Marks (incl. Tlokwe City, Ventersdorp) | Local Municipality | 155,961 | 171,431 | 219,463 | 212,670 | → |
| Kagisano/Molopo | Local Municipality | 97,770 | 100,512 | 105,789 | 112,130 | → |
| Kgetlengrivier | Local Municipality | 32,778 | 36,477 | 51,049 | 54,759 | → |
| Lekwa-Teemane | Local Municipality | 36,869 | 42,967 | 53,248 | 59,815 | → |
| Madibeng | Local Municipality | 317,106 | 343,419 | 475,795 | 522,566 | → |
| Mafikeng (Mahikeng) | Local Municipality | 242,146 | 259,478 | 291,527 | 354,504 | → |
| Mamusa | Local Municipality | 42,736 | 48,366 | 60,355 | 70,483 | → |
| Maquassi Hills | Local Municipality | 62,143 | 69,037 | 77,794 | 90,302 | → |
| Moretele | Local Municipality | 176,473 | 183,116 | 188,533 | 219,120 | → |
| Moses Kotane | Local Municipality | 229,622 | 237,175 | 242,554 | 265,668 | → |
| Naledi | Local Municipality | 54,798 | 56,263 | 66,781 | 63,755 | → |
| Ramotshere Moiloa (Zeerust) | Local Municipality | 129,741 | 137,587 | 150,713 | 161,605 | → |
| Ratlou (Setla-Kgobi) | Local Municipality | 97,787 | 106,165 | 107,339 | 128,766 | → |
| Rustenburg | Local Municipality | 311,187 | 387,096 | 549,575 | 562,315 | → |
| Tswaing | Local Municipality | 91,259 | 114,155 | 124,218 | 128,672 | → |
| South Africa | Republic | 40,583,573 | 44,819,778 | 51,770,560 | 62,027,503 |
Source: Statistics South Africa.
Explanation: Area figures for municipalities are calculated from geospatial data.
Further information about the population structure:
| Gender (C 2022) | |
|---|---|
| Males | 1,885,033 |
| Females | 1,919,515 |
| Age Groups (C 2022) | |
|---|---|
| 0-14 years | 1,077,032 |
| 15-64 years | 2,491,402 |
| 65+ years | 235,816 |
| Age Distribution (C 2022) | |
|---|---|
| 80+ years | 39,560 |
| 70-79 years | 100,067 |
| 60-69 years | 229,282 |
| 50-59 years | 323,507 |
| 40-49 years | 451,409 |
| 30-39 years | 620,148 |
| 20-29 years | 644,585 |
| 10-19 years | 669,911 |
| 0-9 years | 725,781 |
| Population Group (C 2022) | |
|---|---|
| Black African | 3,562,988 |
| White | 171,886 |
| Asian | 2,653 |
| Coloured | 60,714 |
| Other group | 5,894 |