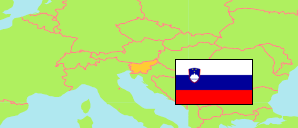
Savinjska
Region in Slovenia
Contents: Subdivision
The population development in Savinjska as well as related information and services (Wikipedia, Google, images).
| Name | Status | Population Census 2002-03-31 | Population Census 2011-01-01 | Population Census 2021-01-01 | Population Estimate 2022-01-01 | |
|---|---|---|---|---|---|---|
| Savinjska [Savinja] | Region | 253,574 | 259,726 | 264,428 | 264,206 | |
| Bistrica ob Sotli | Municipality | 1,460 | 1,436 | 1,356 | 1,361 | → |
| Braslovče | Municipality | 4,933 | 5,291 | 5,656 | 5,681 | → |
| Celje | City Municipality | 48,081 | 48,592 | 49,007 | 48,679 | → |
| Dobje | Municipality | 1,008 | 977 | 934 | 942 | → |
| Dobrna | Municipality | 2,083 | 2,192 | 2,250 | 2,277 | → |
| Gornji Grad | Municipality | 2,595 | 2,665 | 2,480 | 2,552 | → |
| Kozje | Municipality | 3,406 | 3,242 | 3,030 | 3,029 | → |
| Laško | Municipality | 13,730 | 13,550 | 13,123 | 12,976 | → |
| Ljubno | Municipality | 2,701 | 2,675 | 2,576 | 2,542 | → |
| Luče | Municipality | 1,609 | 1,543 | 1,454 | 1,455 | → |
| Mozirje | Municipality | 3,946 | 4,095 | 4,244 | 4,401 | → |
| Nazarje | Municipality | 2,711 | 2,601 | 2,611 | 2,682 | → |
| Podčetrtek | Municipality | 3,224 | 3,325 | 3,614 | 3,657 | → |
| Polzela | Municipality | 5,417 | 5,966 | 6,321 | 6,386 | → |
| Prebold | Municipality | 4,514 | 4,916 | 5,210 | 5,302 | → |
| Radeče | Municipality | 4,617 | 4,445 | 4,164 | 4,146 | → |
| Rečica ob Savinji | Municipality | 2,285 | 2,290 | 2,355 | 2,324 | → |
| Rogaška Slatina | Municipality | 10,544 | 11,004 | 11,323 | 11,438 | → |
| Rogatec | Municipality | 3,191 | 3,143 | 3,138 | 3,055 | → |
| Šentjur | Municipality | 18,470 | 18,899 | 19,378 | 19,378 | → |
| Slovenske Konjice | Municipality | 13,612 | 14,414 | 15,263 | 15,221 | → |
| Šmarje pri Jelšah | Municipality | 9,662 | 10,154 | 10,375 | 10,361 | → |
| Šmartno ob Paki | Municipality | 2,909 | 3,161 | 3,278 | 3,324 | → |
| Solčava | Municipality | 548 | 517 | 529 | 524 | → |
| Šoštanj | Municipality | 8,254 | 8,692 | 8,847 | 8,822 | → |
| Štore | Municipality | 4,060 | 4,270 | 4,477 | 4,396 | → |
| Tabor | Municipality | 1,494 | 1,590 | 1,670 | 1,693 | → |
| Velenje | City Municipality | 33,331 | 32,836 | 33,715 | 33,548 | → |
| Vitanje | Municipality | 2,317 | 2,289 | 2,267 | 2,266 | → |
| Vojnik | Municipality | 7,825 | 8,438 | 9,009 | 9,063 | → |
| Vransko | Municipality | 2,457 | 2,588 | 2,646 | 2,672 | → |
| Žalec | Municipality | 20,335 | 21,483 | 21,528 | 21,477 | → |
| Zreče | Municipality | 6,245 | 6,447 | 6,600 | 6,576 | → |
| Slovenija [Slovenia] | Republic | 1,964,036 | 2,050,189 | 2,108,977 | 2,107,180 |
Source: Statistical Office of the Republic of Slovenia (web).
Explanation: The 2011 and 2021 population figures are result of a register-based census.
Further information about the population structure:
| Gender (E 2022) | |
|---|---|
| Males | 133,903 |
| Females | 130,303 |
| Age Groups (E 2022) | |
|---|---|
| 0-17 years | 47,183 |
| 18-64 years | 162,248 |
| 65+ years | 54,775 |
| Age Distribution (E 2022) | |
|---|---|
| 90+ years | 1,950 |
| 80-89 years | 11,378 |
| 70-79 years | 23,751 |
| 60-69 years | 36,792 |
| 50-59 years | 38,832 |
| 40-49 years | 40,059 |
| 30-39 years | 34,688 |
| 20-29 years | 24,894 |
| 10-19 years | 26,066 |
| 0-9 years | 25,796 |
| Citizenship (E 2022) | |
|---|---|
| Slovenia | 242,696 |
| Foreign Citizenship | 21,510 |
| Country of Birth (E 2018) | |
|---|---|
| Slovenia | 230,883 |
| Former Yugoslavia (w/o Croatia) | 21,198 |
| EU-28 | 7,070 |
| Europe (Rest) | 708 |
| Other country | 458 |