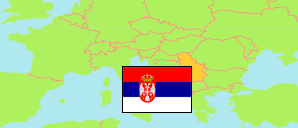
Grad Beograd
District in Serbia
Contents: Subdivision
The population development in Grad Beograd as well as related information and services (Wikipedia, Google, images).
| Name | Status | Native | Population Census 1991-03-31 | Population Census 2002-04-01 | Population Census 2011-09-30 | Population Census 2022-09-30 | |
|---|---|---|---|---|---|---|---|
| Grad Beograd [Belgrade City] | District | Београдска област | 1,552,151 | 1,576,124 | 1,659,440 | 1,681,405 | |
| Barajevo | City Municipality | Барајево | 20,846 | 24,641 | 27,110 | 26,431 | → |
| Čukarica | City Municipality | Чукарица | 150,257 | 168,508 | 181,231 | 175,793 | → |
| Grocka | City Municipality | Гроцка | 65,735 | 75,466 | 83,907 | 82,810 | → |
| Lazarevac | City Municipality | Лазаревац | 57,848 | 58,511 | 58,622 | 55,146 | → |
| Mladenovac | City Municipality | Младеновац | 54,517 | 52,490 | 53,096 | 48,683 | → |
| Novi Beograd | City Municipality | Нови Београд | 218,633 | 217,773 | 214,506 | 209,763 | → |
| Obrenovac | City Municipality | Обреновац | 67,654 | 70,975 | 72,524 | 68,882 | → |
| Palilula (Beograd) | City Municipality | Палилула | 150,208 | 155,902 | 173,521 | 182,624 | → |
| Rakovica | City Municipality | Раковица | 96,300 | 99,000 | 108,641 | 104,456 | → |
| Savski Venac | City Municipality | Савски венац | 45,961 | 42,505 | 39,122 | 36,699 | → |
| Sopot | City Municipality | Сопот | 19,977 | 20,390 | 20,367 | 19,126 | → |
| Stari Grad | City Municipality | Стари град | 68,552 | 55,543 | 48,450 | 44,737 | → |
| Surčin | City Municipality | Сурчин | 34,463 | 38,695 | 43,819 | 45,452 | → |
| Voždovac | City Municipality | Вождовац | 156,373 | 151,768 | 158,213 | 174,864 | → |
| Vračar | City Municipality | Врачар | 67,438 | 58,386 | 56,333 | 55,406 | → |
| Zemun | City Municipality | Земун | 141,695 | 152,950 | 168,170 | 177,908 | → |
| Zvezdara | City Municipality | Звездара | 135,694 | 132,621 | 151,808 | 172,625 | → |
| Srbija [Serbia] | Republik | Србија | 7,576,837 | 7,498,001 | 7,186,862 | 6,647,003 |
Source: Statistical Office of the Republic of Serbia (web).
Explanation: The 2011 census was affected by the boycott of the Albanians in the municipalities Preševo and Bujanovac (both located in the District of Pčinja) and partly affected in Medveđa (District of Jablanica).
Further information about the population structure:
| Gender (C 2022) | |
|---|---|
| Males | 794,413 |
| Females | 886,992 |
| Age Groups (C 2022) | |
|---|---|
| 0-17 years | 301,017 |
| 18-64 years | 1,039,366 |
| 65+ years | 341,022 |
| Age Distribution (C 2022) | |
|---|---|
| 80+ years | 72,980 |
| 70-79 years | 156,167 |
| 60-69 years | 216,006 |
| 50-59 years | 215,422 |
| 40-49 years | 260,766 |
| 30-39 years | 242,275 |
| 20-29 years | 184,336 |
| 10-19 years | 163,083 |
| 0-9 years | 170,370 |
| Urbanization (C 2022) | |
|---|---|
| Rural | 297,530 |
| Urban | 1,383,875 |
| Ethnic Group (C 2022) | |
|---|---|
| Serbs | 1,449,241 |
| Hungarians | 1,386 |
| Bosniaks | 1,515 |
| Roma | 23,160 |
| Albanians | 932 |
| Slovaks | 1,656 |
| Croats | 4,554 |
| Other group | 46,931 |