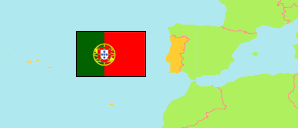
Montalegre
Municipality in Vila Real District
Contents: Subdivision
The population development in Montalegre as well as related information and services (Wikipedia, Google, images).
| Name | Status | Population Census 2001-03-12 | Population Census 2011-03-21 | Population Census 2021-03-22 | |
|---|---|---|---|---|---|
| Montalegre | Municipality | 12,762 | 10,537 | 9,261 | |
| Cabril | Parish | 640 | 553 | 512 | → |
| Cambeses do Rio, Donões e Mourilhe | Parish | 357 | 309 | 273 | → |
| Cervos | Parish | 328 | 271 | 227 | → |
| Chã | Parish | 928 | 748 | 701 | → |
| Covelo do Gerês | Parish | 254 | 194 | 166 | → |
| Ferral | Parish | 547 | 397 | 293 | → |
| Gralhas | Parish | 235 | 208 | 186 | → |
| Meixedo e Padornelos | Parish | 386 | 333 | 265 | → |
| Montalegre e Padroso | Parish | 1,936 | 1,923 | 1,772 | → |
| Morgade | Parish | 275 | 228 | 195 | → |
| Negrões | Parish | 196 | 177 | 132 | → |
| Outeiro | Parish | 203 | 156 | 143 | → |
| Paradela, Contim e Fiães | Parish | 425 | 308 | 245 | → |
| Pitões das Junias | Parish | 201 | 161 | 151 | → |
| Reigoso | Parish | 200 | 167 | 130 | → |
| Salto | Parish | 1,867 | 1,429 | 1,263 | → |
| Santo André | Parish | 271 | 218 | 149 | → |
| Sarraquinhos | Parish | 378 | 294 | 300 | → |
| Sezelhe e Covelães | Parish | 331 | 277 | 229 | → |
| Solveira | Parish | 214 | 154 | 150 | → |
| Tourém | Parish | 185 | 151 | 110 | → |
| Venda Nova e Pondras | Parish | 594 | 393 | 344 | → |
| Viade de Baixo e Fervidelas | Parish | 897 | 762 | 695 | → |
| Vila da Ponte | Parish | 255 | 178 | 167 | → |
| Vilar de Perdizes e Meixide | Parish | 659 | 548 | 463 | → |
| Vila Real | District | 223,729 | 206,661 | 185,695 |
Source: Instituto Nacional de Estatística Portugal (web).
Further information about the population structure:
| Gender (E 2024) | |
|---|---|
| Males | 4,419 |
| Females | 4,681 |
| Age Groups (E 2024) | |
|---|---|
| 0-14 years | 674 |
| 15-64 years | 4,715 |
| 65+ years | 3,711 |
| Age Distribution (E 2024) | |
|---|---|
| 80+ years | 1,303 |
| 70-79 years | 1,580 |
| 60-69 years | 1,661 |
| 50-59 years | 1,150 |
| 40-49 years | 969 |
| 30-39 years | 745 |
| 20-29 years | 741 |
| 10-19 years | 515 |
| 0-9 years | 436 |
| Citizenship (C 2021) | |
|---|---|
| Portugal | 9,138 |
| EU | 46 |
| Europe (other) | 17 |
| Africa | 9 |
| America | 42 |
| Asia & Oceania | 9 |
| Country of Birth (C 2021) | |
|---|---|
| Portugal | 8,769 |
| EU | 242 |
| Europe (other) | 93 |
| Africa | 68 |
| America | 80 |
| Asia & Oceania | 9 |