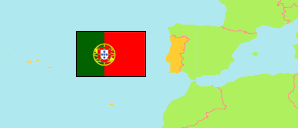
Casas do Soeiro
Parish in Guarda District
Contents: Population
The population development of Casas do Soeiro as well as related information and services (Wikipedia, Google, images).
| Name | Status | Population Census 2001-03-12 | Population Census 2011-03-21 | Population Census 2021-03-22 | |
|---|---|---|---|---|---|
| Casas do Soeiro | Parish | 501 | 499 | 468 | |
| Guarda | District | 179,961 | 160,939 | 142,974 |
Source: Instituto Nacional de Estatística Portugal (web).
Further information about the population structure:
| Gender (C 2021) | |
|---|---|
| Males | 232 |
| Females | 236 |
| Age Groups (C 2021) | |
|---|---|
| 0-14 years | 42 |
| 15-64 years | 290 |
| 65+ years | 136 |
| Age Distribution (C 2021) | |
|---|---|
| 80+ years | 37 |
| 70-79 years | 64 |
| 60-69 years | 69 |
| 50-59 years | 78 |
| 40-49 years | 62 |
| 30-39 years | 38 |
| 20-29 years | 56 |
| 10-19 years | 38 |
| 0-9 years | 26 |
| Citizenship (C 2021) | |
|---|---|
| Portugal | 459 |
| EU | 3 |
| Europe (other) | 2 |
| America | 4 |
| Country of Birth (C 2021) | |
|---|---|
| Portugal | 425 |
| EU | 13 |
| Europe (other) | 3 |
| Africa | 19 |
| America | 8 |