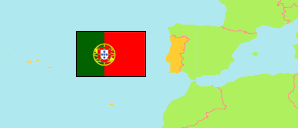
Moura
Municipality in Beja District
Contents: Subdivision
The population development in Moura as well as related information and services (Wikipedia, Google, images).
| Name | Status | Population Census 2001-03-12 | Population Census 2011-03-21 | Population Census 2021-03-22 | |
|---|---|---|---|---|---|
| Moura | Municipality | 16,590 | 15,167 | 13,258 | |
| Amareleja | Parish | 2,763 | 2,564 | 2,030 | → |
| Moura (Santo Agostinho e São João Baptista) e Santo Amador | Parish | 9,678 | 8,831 | 8,039 | → |
| Póvoa de São Miguel | Parish | 1,094 | 888 | 761 | → |
| Safara e Santo Aleixo da Restauração | Parish | 2,009 | 1,871 | 1,566 | → |
| Sobral da Adiça | Parish | 1,046 | 1,013 | 862 | → |
| Beja | District | 161,211 | 152,758 | 144,401 |
Source: Instituto Nacional de Estatística Portugal (web).
Further information about the population structure:
| Gender (C 2021) | |
|---|---|
| Males | 6,432 |
| Females | 6,826 |
| Age Groups (C 2021) | |
|---|---|
| 0-14 years | 1,965 |
| 15-64 years | 7,815 |
| 65+ years | 3,478 |
| Age Distribution (C 2021) | |
|---|---|
| 80+ years | 1,104 |
| 70-79 years | 1,441 |
| 60-69 years | 1,916 |
| 50-59 years | 1,870 |
| 40-49 years | 1,707 |
| 30-39 years | 1,242 |
| 20-29 years | 1,251 |
| 10-19 years | 1,465 |
| 0-9 years | 1,262 |
| Citizenship (C 2021) | |
|---|---|
| Portugal | 13,071 |
| EU | 72 |
| Europe (other) | 35 |
| Africa | 6 |
| America | 57 |
| Asia & Oceania | 17 |
| Country of Birth (C 2021) | |
|---|---|
| Portugal | 12,880 |
| EU | 134 |
| Europe (other) | 100 |
| Africa | 59 |
| America | 71 |
| Asia & Oceania | 14 |