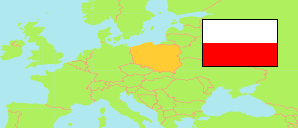
Powiat gryficki
County in West Pomerania Voivodeship
Contents: Subdivision
The population development in Powiat gryficki as well as related information and services (Wikipedia, Google, images).
| Name | Status | Population Census 2002-05-20 | Population Census 2011-03-31 | Population Census 2021-03-31 | Population Estimate 2023-12-31 | |
|---|---|---|---|---|---|---|
| Powiat gryficki [Gryfice County] | County | 61,140 | 61,948 | 57,837 | 56,435 | |
| Brojce | Rural Commune | 3,683 | 3,837 | 3,510 | 3,494 | → |
| Gryfice | Urban-Rural Commune | 23,820 | 24,087 | 23,194 | 22,726 | → |
| Karnice | Rural Commune | 4,166 | 4,210 | 3,814 | 3,683 | → |
| Płoty | Urban-Rural Commune | 9,227 | 9,263 | 8,338 | 8,068 | → |
| Rewal | Rural Commune | 3,237 | 3,745 | 3,674 | 3,590 | → |
| Trzebiatów | Urban-Rural Commune | 17,007 | 16,806 | 15,307 | 14,874 | → |
| Zachodniopomorskie [West Pomerania] | Voivodeship | 1,698,214 | 1,722,883 | 1,657,716 | 1,631,784 |
Source: Główny Urząd Statystyczny, Warszawa.
Further information about the population structure:
| Gender (E 2023) | |
|---|---|
| Males | 27,897 |
| Females | 28,538 |
| Age Groups (E 2023) | |
|---|---|
| 0-17 years | 9,767 |
| 18-64 years | 35,106 |
| 65+ years | 11,562 |
| Age Distribution (E 2023) | |
|---|---|
| 80+ years | 1,874 |
| 70-79 years | 5,283 |
| 60-69 years | 8,471 |
| 50-59 years | 6,997 |
| 40-49 years | 9,246 |
| 30-39 years | 7,810 |
| 20-29 years | 5,860 |
| 10-19 years | 5,987 |
| 0-9 years | 4,907 |
| Urbanization (E 2023) | |
|---|---|
| Rural | 28,073 |
| Urban | 28,362 |
| Citizenship (C 2021) | |
|---|---|
| Poland | 57,754 |
| Other Citizenship | 83 |
| Country of Birth (C 2021) | |
|---|---|
| Poland | 56,289 |
| Other country | 1,484 |