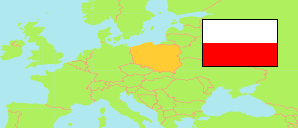
Powiat cieszyński
County in Silesia Voivodeship
Contents: Subdivision
The population development in Powiat cieszyński as well as related information and services (Wikipedia, Google, images).
| Name | Status | Population Census 2002-05-20 | Population Census 2011-03-31 | Population Census 2021-03-31 | |
|---|---|---|---|---|---|
| Powiat cieszyński [Cieszyn County] | County | 169,109 | 176,062 | 176,743 | |
| Brenna | Rural Commune | 9,751 | 10,801 | 11,692 | → |
| Chybie | Rural Commune | 8,863 | 9,398 | 9,646 | → |
| Cieszyn | Urban Commune | 36,640 | 36,248 | 33,958 | → |
| Dębowiec | Rural Commune | 5,318 | 5,609 | 5,778 | → |
| Goleszów | Rural Commune | 11,871 | 12,669 | 13,139 | → |
| Hażlach | Rural Commune | 9,476 | 10,386 | 10,803 | → |
| Istebna | Rural Commune | 11,150 | 11,759 | 12,150 | → |
| Skoczów | Urban-Rural Commune | 25,381 | 26,453 | 26,390 | → |
| Strumień | Urban-Rural Commune | 11,699 | 12,486 | 13,265 | → |
| Ustroń | Urban Commune | 15,322 | 15,956 | 16,118 | → |
| Wisła | Urban Commune | 11,430 | 11,335 | 10,887 | → |
| Zebrzydowice | Rural Commune | 12,208 | 12,962 | 12,917 | → |
| Śląskie [Silesia] | Voivodeship | 4,742,874 | 4,630,364 | 4,402,950 |
Source: Główny Urząd Statystyczny, Warszawa (web).
Further information about the population structure:
| Gender (C 2021) | |
|---|---|
| Males | 85,849 |
| Females | 90,894 |
| Age Groups (C 2021) | |
|---|---|
| 0-17 years | 34,354 |
| 18-64 years | 109,267 |
| 65+ years | 33,122 |
| Age Distribution (C 2021) | |
|---|---|
| 90+ years | 1,083 |
| 80-89 years | 6,212 |
| 70-79 years | 13,904 |
| 60-69 years | 24,049 |
| 50-59 years | 22,194 |
| 40-49 years | 26,846 |
| 30-39 years | 25,722 |
| 20-29 years | 18,908 |
| 10-19 years | 18,737 |
| 0-9 years | 19,088 |
| Urbanization (C 2021) | |
|---|---|
| Rural | 98,358 |
| Urban | 78,385 |