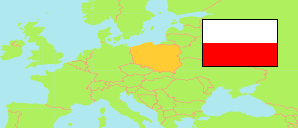
Powiat rzeszowski
County in Subcarpathia Voivodeship
Contents: Subdivision
The population development in Powiat rzeszowski as well as related information and services (Wikipedia, Google, images).
| Name | Status | Population Census 2002-05-20 | Population Census 2011-03-31 | Population Census 2021-03-31 | |
|---|---|---|---|---|---|
| Powiat rzeszowski [Rzeszów County] | County | 169,309 | 162,438 | 173,189 | |
| Błażowa | Urban-Rural Commune | 10,723 | 10,766 | 10,839 | → |
| Boguchwała | Urban-Rural Commune | 20,471 | 18,929 | 21,807 | → |
| Chmielnik | Rural Commune | 6,252 | 6,668 | 7,325 | → |
| Dynów | Urban Commune | 6,091 | 6,228 | 6,085 | → |
| Dynów (gm.w.) | Rural Commune | 7,223 | 7,146 | 6,725 | → |
| Głogów Małopolski | Urban-Rural Commune | 17,312 | 18,627 | 19,221 | → |
| Hyżne | Rural Commune | 6,736 | 6,971 | 6,949 | → |
| Kamień | Rural Commune | 6,761 | 6,990 | 6,864 | → |
| Krasne | Rural Commune | 13,392 | 10,294 | 12,475 | → |
| Lubenia | Rural Commune | 6,473 | 6,524 | 6,585 | → |
| Sokołów Małopolski | Urban-Rural Commune | 16,308 | 16,925 | 17,334 | → |
| Świlcza | Rural Commune | 18,365 | 15,357 | 16,467 | → |
| Trzebownisko | Rural Commune | 18,135 | 19,972 | 23,361 | → |
| Tyczyn | Urban-Rural Commune | 15,067 | 11,041 | 11,152 | → |
| Podkarpackie [Subcarpathia] | Voivodeship | 2,095,515 | 2,127,285 | 2,093,360 |
Source: Główny Urząd Statystyczny, Warszawa (web).
Further information about the population structure:
| Gender (C 2021) | |
|---|---|
| Males | 85,639 |
| Females | 87,550 |
| Age Groups (C 2021) | |
|---|---|
| 0-17 years | 37,014 |
| 18-64 years | 109,623 |
| 65+ years | 26,552 |
| Age Distribution (C 2021) | |
|---|---|
| 90+ years | 1,189 |
| 80-89 years | 6,105 |
| 70-79 years | 10,755 |
| 60-69 years | 18,426 |
| 50-59 years | 21,160 |
| 40-49 years | 26,112 |
| 30-39 years | 27,895 |
| 20-29 years | 20,848 |
| 10-19 years | 19,705 |
| 0-9 years | 20,994 |
| Urbanization (C 2021) | |
|---|---|
| Rural | 139,947 |
| Urban | 33,242 |