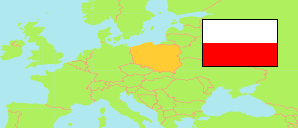
Czarnia
Rural Commune in Mazovia Voivodeship
Contents: Population
The population development of Czarnia as well as related information and services (Wikipedia, Google, images).
| Name | Status | Population Census 2002-05-20 | Population Census 2011-03-31 | Population Census 2021-03-31 | |
|---|---|---|---|---|---|
| Czarnia | Rural Commune | 2,674 | 2,762 | 2,283 | |
| Mazowieckie [Mazovia] | Voivodeship | 5,124,018 | 5,268,660 | 5,514,699 |
Source: Główny Urząd Statystyczny, Warszawa (web).
Further information about the population structure:
| Gender (C 2021) | |
|---|---|
| Males | 1,176 |
| Females | 1,107 |
| Age Groups (C 2021) | |
|---|---|
| 0-17 years | 491 |
| 18-64 years | 1,473 |
| 65+ years | 319 |
| Age Distribution (C 2021) | |
|---|---|
| 90+ years | 13 |
| 80-89 years | 86 |
| 70-79 years | 124 |
| 60-69 years | 222 |
| 50-59 years | 318 |
| 40-49 years | 311 |
| 30-39 years | 308 |
| 20-29 years | 339 |
| 10-19 years | 331 |
| 0-9 years | 231 |
| Urbanization (C 2021) | |
|---|---|
| Rural | 2,283 |