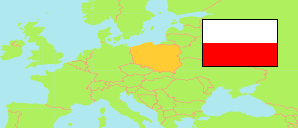
Zachodniopomorskie
Voivodeship in Poland
Contents: Subdivision
The population development in Zachodniopomorskie as well as related information and services (Wikipedia, Google, images).
| Name | Status | Population Census 2002-05-20 | Population Census 2011-03-31 | Population Census 2021-03-31 | Population Estimate 2023-12-31 | |
|---|---|---|---|---|---|---|
| Zachodniopomorskie [West Pomerania] | Voivodeship | 1,698,214 | 1,722,883 | 1,657,716 | 1,631,784 | |
| Powiat białogardzki [Białogard County] | County | 48,463 | 49,408 | 45,574 | 44,373 | → |
| Powiat choszczeński [Choszczno County] | County | 50,446 | 50,545 | 45,613 | 44,422 | → |
| Powiat drawski [Drawsko County] | County | 58,910 | 58,932 | 54,758 | 53,516 | → |
| Powiat goleniowski [Goleniów County] | County | 77,299 | 81,722 | 81,963 | 81,363 | → |
| Powiat gryficki [Gryfice County] | County | 61,140 | 61,948 | 57,837 | 56,435 | → |
| Powiat gryfiński [Gryfino County] | County | 83,340 | 84,346 | 78,821 | 76,959 | → |
| Powiat kamieński [Kamień County] | County | 47,959 | 48,512 | 45,112 | 44,137 | → |
| Powiat kołobrzeski [Kołobrzeg County] | County | 75,105 | 79,378 | 77,695 | 76,721 | → |
| Powiat Koszalin | Urban County | 108,709 | 109,248 | 105,883 | 105,540 | → |
| Powiat koszaliński [Koszalin County] | County | 62,890 | 65,439 | 66,397 | 64,450 | → |
| Powiat łobeski [Łobez County] | County | 38,583 | 38,483 | 34,464 | 33,394 | → |
| Powiat myśliborski [Myślibórz County] | County | 68,022 | 68,100 | 63,764 | 62,224 | → |
| Powiat policki [Police County] | County | 59,630 | 71,347 | 82,991 | 85,917 | → |
| Powiat pyrzycki [Pyrzyce County] | County | 40,243 | 40,847 | 37,372 | 36,413 | → |
| Powiat sławieński [Sławno County] | County | 57,860 | 58,127 | 54,193 | 52,903 | → |
| Powiat stargardzki [Stargard County] | County | 119,861 | 120,900 | 119,138 | 119,090 | → |
| Powiat świdwiński [Świdwin County] | County | 49,577 | 49,343 | 44,445 | 43,237 | → |
| Powiat Świnoujście | Urban County | 41,796 | 41,480 | 40,204 | 38,904 | → |
| Powiat Szczecin | Urban County | 415,399 | 410,131 | 396,168 | 389,066 | → |
| Powiat szczecinecki [Szczecinek County] | County | 77,728 | 79,565 | 74,307 | 72,717 | → |
| Powiat wałecki [Wałcz County] | County | 55,254 | 55,082 | 51,017 | 50,003 | → |
| Polska [Poland] | Republic | 38,230,080 | 38,511,824 | 38,036,118 | 37,636,508 |
Source: Główny Urząd Statystyczny, Warszawa.
Further information about the population structure:
| Gender (E 2023) | |
|---|---|
| Males | 791,367 |
| Females | 840,417 |
| Age Groups (E 2023) | |
|---|---|
| 0-17 years | 278,798 |
| 18-64 years | 1,004,204 |
| 65+ years | 348,782 |
| Age Distribution (E 2023) | |
|---|---|
| 80+ years | 65,015 |
| 70-79 years | 161,599 |
| 60-69 years | 229,030 |
| 50-59 years | 200,699 |
| 40-49 years | 272,485 |
| 30-39 years | 232,637 |
| 20-29 years | 161,122 |
| 10-19 years | 166,316 |
| 0-9 years | 142,881 |
| Urbanization (E 2023) | |
|---|---|
| Rural | 521,378 |
| Urban | 1,110,406 |
| Citizenship (C 2021) | |
|---|---|
| Poland | 1,652,764 |
| Other Citizenship | 4,934 |
| Country of Birth (C 2021) | |
|---|---|
| Poland | 1,608,772 |
| Other country | 47,327 |