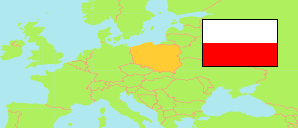
Śląskie
Voivodeship in Poland
Contents: Subdivision
The population development in Śląskie as well as related information and services (Wikipedia, Google, images).
| Name | Status | Population Census 2002-05-20 | Population Census 2011-03-31 | Population Census 2021-03-31 | |
|---|---|---|---|---|---|
| Śląskie [Silesia] | Voivodeship | 4,742,874 | 4,630,364 | 4,402,950 | |
| Powiat będziński [Będzin County] | County | 152,232 | 152,134 | 147,259 | → |
| Powiat bielski [Bielsko County] | County | 146,912 | 157,327 | 165,593 | → |
| Powiat Bielsko-Biała | Urban County | 178,028 | 174,534 | 169,089 | → |
| Powiat bieruńsko-lędziński [Bieruń-Lędziny County] | County | 55,517 | 57,695 | 59,438 | → |
| Powiat Bytom | Urban County | 193,546 | 176,902 | 153,274 | → |
| Powiat Chorzów | Urban County | 117,430 | 111,692 | 104,193 | → |
| Powiat cieszyński [Cieszyn County] | County | 169,109 | 176,062 | 176,743 | → |
| Powiat Częstochowa | Urban County | 251,436 | 236,796 | 213,107 | → |
| Powiat częstochowski [Częstochowa County] | County | 133,749 | 136,084 | 133,175 | → |
| Powiat Dąbrowa Górnicza | Urban County | 132,236 | 125,905 | 116,930 | → |
| Powiat Gliwice | Urban County | 203,814 | 187,474 | 174,016 | → |
| Powiat gliwicki [Gliwice County] | County | 117,486 | 115,030 | 113,703 | → |
| Powiat Jastrzębie-Zdrój | Urban County | 97,116 | 92,465 | 85,050 | → |
| Powiat Jaworzno | Urban County | 96,826 | 94,732 | 88,998 | → |
| Powiat Katowice | Urban County | 327,222 | 310,764 | 285,711 | → |
| Powiat kłobucki [Kłobuck County] | County | 84,915 | 85,714 | 83,211 | → |
| Powiat lubliniecki [Lubliniec County] | County | 77,186 | 77,215 | 75,715 | → |
| Powiat mikołowski [Mikołów County] | County | 90,360 | 94,205 | 99,429 | → |
| Powiat Mysłowice | Urban County | 75,712 | 75,446 | 72,553 | → |
| Powiat myszkowski [Myszków County] | County | 72,345 | 72,084 | 69,124 | → |
| Powiat Piekary Śląskie | Urban County | 60,909 | 57,917 | 53,017 | → |
| Powiat pszczyński [Pszczyna County] | County | 103,377 | 107,815 | 111,003 | → |
| Powiat raciborski [Racibórz County] | County | 114,418 | 110,099 | 101,615 | → |
| Powiat Ruda Śląska | Urban County | 150,595 | 142,510 | 133,793 | → |
| Powiat rybnicki [Rybnik County] | County | 72,926 | 76,094 | 76,913 | → |
| Powiat Rybnik | Urban County | 142,731 | 140,924 | 133,772 | → |
| Powiat Siemianowice Śląskie | Urban County | 74,269 | 70,170 | 64,676 | → |
| Powiat Sosnowiec | Urban County | 232,622 | 216,420 | 193,660 | → |
| Powiat Świętochłowice | Urban County | 56,410 | 53,150 | 46,494 | → |
| Powiat tarnogórski [Tarnowskie Góry County] | County | 139,676 | 138,259 | 139,061 | → |
| Powiat Tychy | Urban County | 132,816 | 129,378 | 124,882 | → |
| Powiat wodzisławski [Wodzisław County] | County | 155,315 | 158,193 | 152,619 | → |
| Powiat Zabrze | Urban County | 195,293 | 181,128 | 158,307 | → |
| Powiat zawierciański [Zawiercie County] | County | 126,091 | 123,021 | 114,665 | → |
| Powiat Żory | Urban County | 63,461 | 62,094 | 61,823 | → |
| Powiat żywiecki [Żywiec County] | County | 148,788 | 152,932 | 150,339 | → |
| Polska [Poland] | Republic | 38,230,080 | 38,511,824 | 38,036,118 |
Source: Główny Urząd Statystyczny, Warszawa (web).
Further information about the population structure:
| Gender (C 2021) | |
|---|---|
| Males | 2,120,229 |
| Females | 2,282,721 |
| Age Groups (C 2021) | |
|---|---|
| 0-17 years | 767,323 |
| 18-64 years | 2,766,051 |
| 65+ years | 869,576 |
| Age Distribution (C 2021) | |
|---|---|
| 90+ years | 27,333 |
| 80-89 years | 171,662 |
| 70-79 years | 367,389 |
| 60-69 years | 627,504 |
| 50-59 years | 558,915 |
| 40-49 years | 676,070 |
| 30-39 years | 680,390 |
| 20-29 years | 451,889 |
| 10-19 years | 417,329 |
| 0-9 years | 424,469 |
| Urbanization (C 2021) | |
|---|---|
| Rural | 1,050,988 |
| Urban | 3,351,962 |