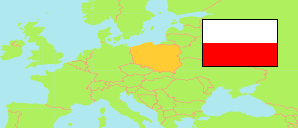
Pomorskie
Voivodeship in Poland
Contents: Subdivision
The population development in Pomorskie as well as related information and services (Wikipedia, Google, images).
| Name | Status | Population Census 2002-05-20 | Population Census 2011-03-31 | Population Census 2021-03-31 | Population Estimate 2023-12-31 | |
|---|---|---|---|---|---|---|
| Pomorskie [Pomerania] | Voivodeship | 2,179,900 | 2,276,176 | 2,357,320 | 2,359,573 | |
| Powiat bytowski [Bytów County] | County | 75,092 | 78,144 | 77,343 | 76,502 | → |
| Powiat chojnicki [Chojnice County] | County | 89,982 | 95,605 | 96,344 | 96,024 | → |
| Powiat człuchowski [Człuchów County] | County | 56,882 | 57,628 | 54,240 | 53,135 | → |
| Powiat Gdańsk | Urban County | 461,334 | 460,276 | 486,022 | 487,371 | → |
| Powiat gdański [Gdańsk County] | County | 79,874 | 99,000 | 126,898 | 131,728 | → |
| Powiat Gdynia | Urban County | 253,458 | 249,139 | 245,222 | 241,189 | → |
| Powiat kartuski [Kartuzy County] | County | 103,307 | 119,954 | 147,993 | 153,813 | → |
| Powiat kościerski [Kościerzyna County] | County | 65,406 | 70,474 | 72,391 | 72,202 | → |
| Powiat kwidzyński [Kwidzyn County] | County | 79,769 | 83,377 | 81,329 | 80,146 | → |
| Powiat lęborski [Lębork County] | County | 63,361 | 66,143 | 64,264 | 63,677 | → |
| Powiat malborski [Malbork County] | County | 63,006 | 64,827 | 61,779 | 60,647 | → |
| Powiat nowodworski [Nowy Dwór Gdański County] | County | 35,669 | 36,522 | 34,202 | 33,626 | → |
| Powiat pucki [Puck County] | County | 71,461 | 79,347 | 89,759 | 91,664 | → |
| Powiat Słupsk | Urban County | 99,943 | 95,882 | 87,660 | 85,504 | → |
| Powiat słupski [Słupsk County] | County | 91,617 | 96,648 | 96,418 | 96,293 | → |
| Powiat Sopot | Urban County | 41,927 | 38,690 | 32,962 | 31,903 | → |
| Powiat starogardzki [Starogard County] | County | 120,552 | 126,558 | 125,854 | 125,125 | → |
| Powiat sztumski [Sztum County] | County | 42,012 | 42,758 | 39,479 | 38,341 | → |
| Powiat tczewski [Tczew County] | County | 111,734 | 115,640 | 112,542 | 111,237 | → |
| Powiat wejherowski [Wejherowo County] | County | 173,514 | 199,564 | 224,619 | 229,446 | → |
| Polska [Poland] | Republic | 38,230,080 | 38,511,824 | 38,036,118 | 37,636,508 |
Source: Główny Urząd Statystyczny, Warszawa.
Further information about the population structure:
| Gender (E 2023) | |
|---|---|
| Males | 1,145,754 |
| Females | 1,213,819 |
| Age Groups (E 2023) | |
|---|---|
| 0-17 years | 462,578 |
| 18-64 years | 1,458,410 |
| 65+ years | 438,585 |
| Age Distribution (E 2023) | |
|---|---|
| 80+ years | 90,164 |
| 70-79 years | 200,637 |
| 60-69 years | 284,147 |
| 50-59 years | 276,642 |
| 40-49 years | 377,116 |
| 30-39 years | 367,365 |
| 20-29 years | 254,714 |
| 10-19 years | 260,788 |
| 0-9 years | 248,000 |
| Urbanization (E 2023) | |
|---|---|
| Rural | 889,112 |
| Urban | 1,470,461 |
| Citizenship (C 2021) | |
|---|---|
| Poland | 2,350,254 |
| Other Citizenship | 7,039 |
| Country of Birth (C 2021) | |
|---|---|
| Poland | 2,308,035 |
| Other country | 47,954 |