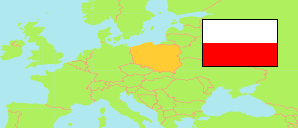
Małopolskie
Voivodeship in Poland
Contents: Subdivision
The population development in Małopolskie as well as related information and services (Wikipedia, Google, images).
| Name | Status | Population Census 2002-05-20 | Population Census 2011-03-31 | Population Census 2021-03-31 | |
|---|---|---|---|---|---|
| Małopolskie [Lesser Poland] | Voivodeship | 3,240,730 | 3,337,471 | 3,432,295 | |
| Powiat bocheński [Bochnia County] | County | 97,699 | 103,357 | 106,802 | → |
| Powiat brzeski [Brzesko County] | County | 89,193 | 92,225 | 92,223 | → |
| Powiat chrzanowski [Chrzanów County] | County | 129,066 | 127,948 | 121,485 | → |
| Powiat dąbrowski [Dąbrowa County] | County | 58,358 | 59,495 | 58,234 | → |
| Powiat gorlicki [Gorlice County] | County | 106,185 | 109,155 | 106,818 | → |
| Powiat Kraków [Krakow] | Urban County | 758,544 | 757,611 | 800,653 | → |
| Powiat krakowski [Kraków County] | County | 238,257 | 259,706 | 296,570 | → |
| Powiat limanowski [Limanowa County] | County | 118,818 | 126,816 | 131,227 | → |
| Powiat miechowski [Miechów County] | County | 51,701 | 50,484 | 47,699 | → |
| Powiat myślenicki [Myślenice County] | County | 113,717 | 121,797 | 129,211 | → |
| Powiat nowosądecki [Nowy Sącz County] | County | 192,751 | 207,753 | 214,547 | → |
| Powiat nowotarski [Nowy Targ County] | County | 178,782 | 187,982 | 190,532 | → |
| Powiat Nowy Sącz | Urban County | 84,477 | 84,290 | 81,281 | → |
| Powiat olkuski [Olkusz County] | County | 115,008 | 114,832 | 108,665 | → |
| Powiat oświęcimski [Oświęcim County] | County | 153,338 | 154,998 | 151,008 | → |
| Powiat proszowicki [Proszowice County] | County | 43,601 | 43,978 | 42,744 | → |
| Powiat suski [Sucha County] | County | 81,128 | 83,829 | 83,324 | → |
| Powiat Tarnów | Urban County | 119,913 | 114,053 | 106,259 | → |
| Powiat tarnowski [Tarnów County] | County | 190,203 | 197,791 | 198,380 | → |
| Powiat tatrzański [Tatra County] | County | 65,317 | 67,373 | 66,949 | → |
| Powiat wadowicki [Wadowice County] | County | 152,711 | 158,017 | 158,594 | → |
| Powiat wielicki [Wieliczka County] | County | 101,963 | 113,981 | 139,090 | → |
| Polska [Poland] | Republic | 38,230,080 | 38,511,824 | 38,036,118 |
Source: Główny Urząd Statystyczny, Warszawa (web).
Further information about the population structure:
| Gender (C 2021) | |
|---|---|
| Males | 1,665,176 |
| Females | 1,767,119 |
| Age Groups (C 2021) | |
|---|---|
| 0-17 years | 661,696 |
| 18-64 years | 2,177,832 |
| 65+ years | 592,767 |
| Age Distribution (C 2021) | |
|---|---|
| 90+ years | 23,761 |
| 80-89 years | 126,607 |
| 70-79 years | 244,663 |
| 60-69 years | 412,554 |
| 50-59 years | 406,435 |
| 40-49 years | 507,072 |
| 30-39 years | 557,064 |
| 20-29 years | 426,014 |
| 10-19 years | 354,879 |
| 0-9 years | 373,246 |
| Urbanization (C 2021) | |
|---|---|
| Rural | 1,784,160 |
| Urban | 1,648,135 |