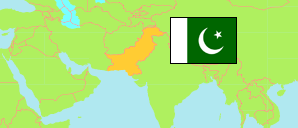
Multan
District in Pakistan
Contents: Subdivision
The population development in Multan as well as related information and services (Wikipedia, Google, images).
| Name | Status | Population Census 1998-03-01 | Population Census 2017-03-15 | |
|---|---|---|---|---|
| Multan | District | 3,116,851 | 4,746,166 | |
| Jalalpur Pirwala | Tehsil | 364,716 | 554,971 | → |
| Multan City | Tehsil | 1,381,478 | 2,259,115 | → |
| Multan Saddar | Tehsil | 950,034 | 1,323,076 | → |
| Shujabad | Tehsil | 420,623 | 609,004 | → |
| Pakistan | Republic | 132,352,279 | 207,684,626 |
Source: Pakistan Bureau of Statistics.
Explanation: The Pakistani-administered parts of Kashmir are not tabulated. Districts in 2023 boundaries.
Further information about the population structure:
| Gender (C 2017) | |
|---|---|
| Males | 2,435,195 |
| Females | 2,310,408 |
| Transgender | 563 |
| Age Groups (C 2017) | |
|---|---|
| 0-14 years | 1,845,910 |
| 15-64 years | 2,737,304 |
| 65+ years | 162,952 |
| Age Distribution (C 2017) | |
|---|---|
| 0-9 years | 1,293,514 |
| 10-19 years | 1,034,810 |
| 20-29 years | 822,457 |
| 30-39 years | 637,237 |
| 40-49 years | 420,711 |
| 50-59 years | 277,393 |
| 60-69 years | 162,053 |
| 70+ years | 97,991 |
| Urbanization (C 2017) | |
|---|---|
| Rural | 2,687,246 |
| Urban | 2,058,920 |
| Literacy (A10+) (C 2017) | |
|---|---|
| yes | 2,078,982 |
| no | 1,373,670 |
| Mother Tongue (C 2017) | |
|---|---|
| Urdu | 769,087 |
| Punjabi | 843,437 |
| Sindhi | 4,638 |
| Pushto | 33,208 |
| Balochi | 6,434 |
| Kashmiri | 1,108 |
| Saraiki | 3,057,098 |
| Hindko | 5,236 |
| Brahvi | 2,848 |
| Other Language | 23,072 |