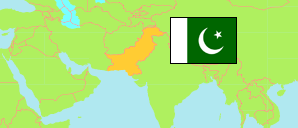
Kohlu
District in Pakistan
Contents: Subdivision
The population development in Kohlu as well as related information and services (Wikipedia, Google, images).
| Name | Status | Population Census 1998-03-01 | Population Census 2017-03-15 | |
|---|---|---|---|---|
| Kohlu | District | 99,846 | 213,933 | |
| Grisani | Sub Tehsil | 4,057 | 17,027 | → |
| Kahan | Tehsil | 26,765 | 73,833 | → |
| Kohlu | Tehsil | 26,702 | 45,152 | → |
| Mawand | Tehsil | 24,056 | 41,516 | → |
| Tamboo | Tehsil | 18,266 | 36,405 | → |
| Pakistan | Republic | 132,352,279 | 207,684,626 |
Source: Pakistan Bureau of Statistics.
Explanation: The Pakistani-administered parts of Kashmir are not tabulated. Districts in 2023 boundaries.
Further information about the population structure:
| Gender (C 2017) | |
|---|---|
| Males | 112,124 |
| Females | 101,809 |
| Age Groups (C 2017) | |
|---|---|
| 0-14 years | 108,118 |
| 15-64 years | 99,680 |
| 65+ years | 6,135 |
| Age Distribution (C 2017) | |
|---|---|
| 0-9 years | 77,735 |
| 10-19 years | 52,120 |
| 20-29 years | 28,905 |
| 30-39 years | 21,870 |
| 40-49 years | 14,473 |
| 50-59 years | 9,119 |
| 60-69 years | 5,528 |
| 70+ years | 4,183 |
| Urbanization (C 2017) | |
|---|---|
| Rural | 196,490 |
| Urban | 17,443 |
| Literacy (A10+) (C 2017) | |
|---|---|
| yes | 25,567 |
| no | 110,631 |
| Mother Tongue (C 2017) | |
|---|---|
| Urdu | 513 |
| Punjabi | 346 |
| Sindhi | 1,271 |
| Pushto | 10,898 |
| Balochi | 199,271 |
| Kashmiri | 223 |
| Saraiki | 430 |
| Hindko | 86 |
| Brahvi | 755 |
| Other Language | 140 |