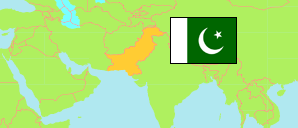
Khairpur
District in Pakistan
Contents: Population
The population development of Khairpur as well as related information and services (Wikipedia, Google, images).
| Name | Status | Population Census 1972-09-16 | Population Census 1981-03-01 | Population Census 1998-03-01 | Population Census 2017-03-15 | Population Census 2023-03-01 | |
|---|---|---|---|---|---|---|---|
| Khairpur | District | 724,935 | 981,190 | 1,547,751 | 2,405,190 | 2,597,535 | |
| Pakistan | Republic | 65,309,340 | 84,253,644 | 132,352,279 | 207,684,626 | 241,499,431 |
Source: Pakistan Bureau of Statistics, U.S. Bureau of Census: Demobase Pakistan.
Explanation: The Pakistani-administered parts of Kashmir are not tabulated.
Further information about the population structure:
| Gender (C 2017) | |
|---|---|
| Males | 1,240,254 |
| Females | 1,164,826 |
| Transgender | 110 |
| Age Groups (C 2017) | |
|---|---|
| 0-14 years | 1,089,552 |
| 15-64 years | 1,244,540 |
| 65+ years | 71,098 |
| Age Distribution (C 2017) | |
|---|---|
| 0-9 years | 796,830 |
| 10-19 years | 551,950 |
| 20-29 years | 366,503 |
| 30-39 years | 280,542 |
| 40-49 years | 186,729 |
| 50-59 years | 110,572 |
| 60-69 years | 70,203 |
| 70+ years | 41,861 |
| Urbanization (C 2017) | |
|---|---|
| Rural | 1,628,184 |
| Urban | 777,006 |
| Literacy (A10+) (C 2017) | |
|---|---|
| yes | 790,547 |
| no | 817,813 |
| Mother Tongue (C 2017) | |
|---|---|
| Urdu | 18,602 |
| Punjabi | 37,191 |
| Sindhi | 2,300,403 |
| Pushto | 4,133 |
| Balochi | 12,166 |
| Kashmiri | 52 |
| Saraiki | 16,101 |
| Hindko | 2,596 |
| Brahvi | 10,493 |
| Other Language | 3,453 |